Chart Patterns: How to Read and Interpret them Effectively


Chart patterns are a go-to tool in technical analysis, helping traders make sense of price movements. These recurring formations can signal whether an asset is likely to keep trending, reverse direction, or take a breather before its next move.
But here’s the thing—patterns don’t predict the future. They reflect market psychology, not certainties. That’s why seasoned traders use them as part of a broader strategy, combining them with indicators, volume analysis, and risk management to make informed decisions.
In this guide, we’ll cover:
- The three main types of chart patterns (continuation, reversal, and consolidation)
- How to identify and interpret them
- Practical ways traders use them to refine entry and exit points
Let’s break it down.
Chart patterns help traders identify recurring geometric shapes in financial markets, offering insights into potential buying and selling opportunities.
These patterns generally suggest either a continuation of the current trend or a possible reversal.
Each pattern is formed by key price levels, such as highs, lows, and trendlines, which traders use to determine entry points, stop losses, and profit targets.
While chart patterns are widely used to anticipate market behavior, their effectiveness remains a topic of debate. Many traders combine them with other tools to improve decision-making.
What are Chart Patterns?
Chart patterns are geometric formations that appear on stock charts, helping traders anticipate potential price movements. They emerge as price fluctuates over time, forming recognizable shapes that traders use to refine their decisions.
There are three main types of chart patterns:
- Continuation patterns signal that an ongoing trend is likely to persist.
- Reversal patterns suggest a possible shift in direction.
- Consolidation patterns indicate a temporary standoff between buyers and sellers before the market makes its next move.
Each pattern is built around key price levels—support and resistance zones—where buying or selling pressure intensifies. Trendlines help define these formations, making it easier to spot market direction.
Understanding these elements may help traders recognize emerging trends and refine their entry and exit points.
Examples of a Chart Pattern
To see how chart patterns work in practice, let’s look at a real example.
In this chart, Hermès’ share price forms a cup with handle pattern—a classic bullish continuation setup:
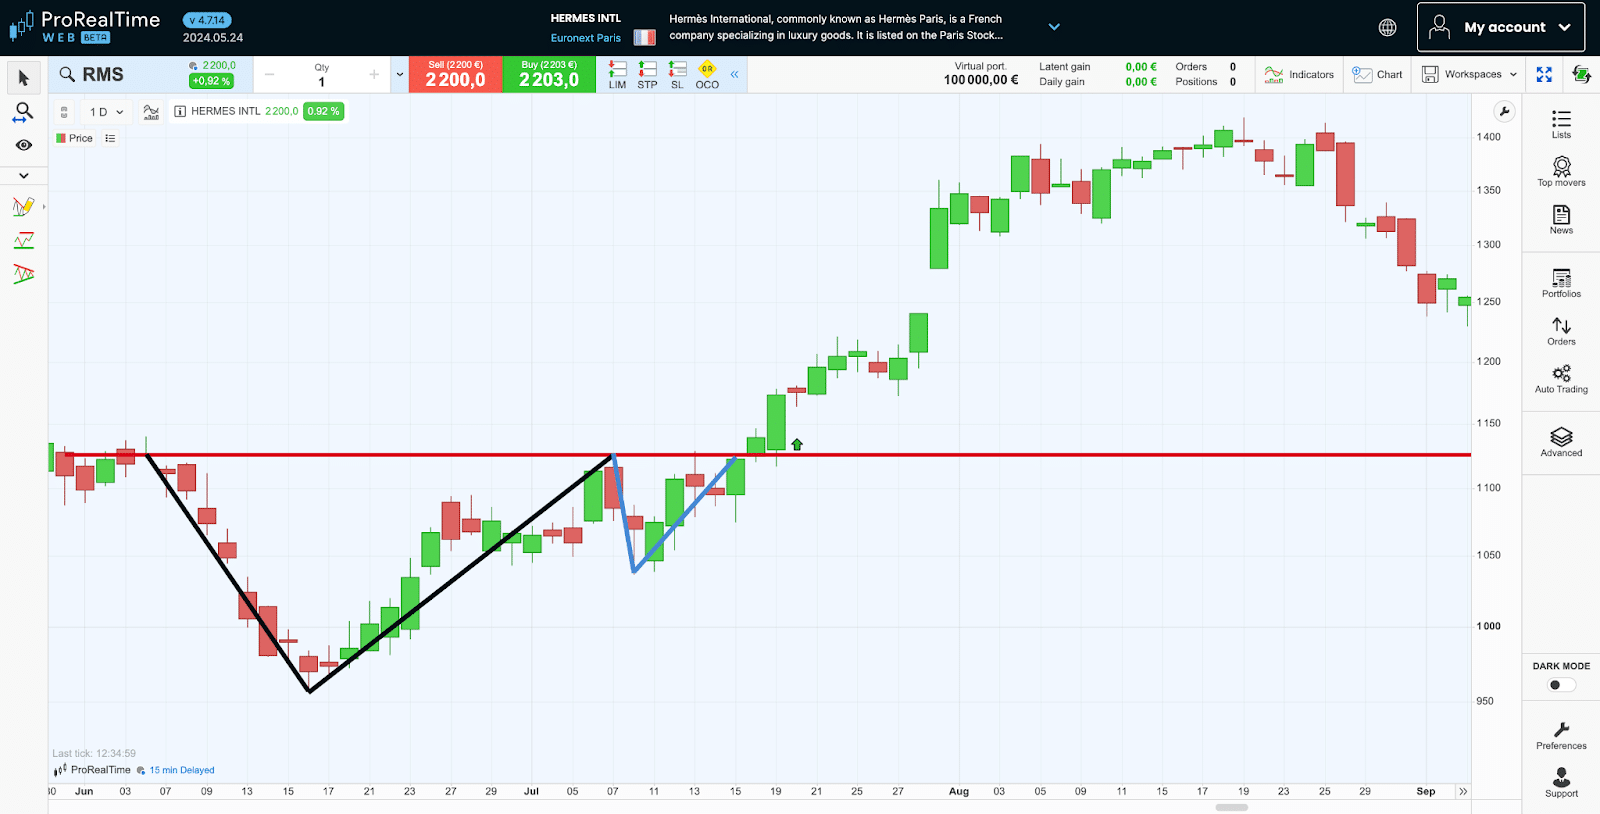
The first dip (black) represents the “cup,” showing a rounded bottom as the price stabilizes.
The second, smaller dip (blue) is the “handle,” where the market briefly consolidates before a breakout. Once the price crosses the horizontal resistance level (red), the upward trend accelerates.
This example highlights how traders use chart patterns to spot potential breakout opportunities and make more informed trading decisions.
Common Chart Patterns
Chart patterns come in all shapes and sizes—some look like letters, others like familiar objects. But they all serve the same purpose: helping traders make sense of price action.
Here’s a breakdown of the most well-known types:
Continuation Patterns
These patterns suggest that the market is likely to keep moving in the same direction—whether that’s up (bullish) or down (bearish).
| Chart Pattern | Signal |
|---|---|
| Bullish canal | Bullish |
| Bearish canal | Bearish |
| Bullish pennant | Bullish |
| Bearish pennant | Bearish |
| Ascending triangle | Bullish |
| Descending triangle | Bearish |
| Cup with handle | Bullish |
| Inverted cup and handle | Bearish |
Reversal Patterns
Reversal patterns signal a potential trend change, such as a bullish trend turning bearish—or vice versa.
| Chart Pattern | Signal |
|---|---|
| Double top | Bearish |
| Double bottom | Bullish |
| Rounding top | Bearish |
| Rounding bottom | Bullish |
| Head and shoulders | Bearish |
| Inverse head and shoulders | Bullish |
| Diamond top | Bearish |
| Diamond bottom | Bullish |
Consolidation Patterns
Consolidation patterns appear when the market is undecided—prices stall, and buyers and sellers battle for control. When the pattern resolves, the market typically breaks out in a new direction.
| Chart patterns | Signal |
|---|---|
| Range | Neutral |
| Descending bevel | Neutral |
| Ascending bevel | Neutral |
| Symmetrical triangle | Neutral |
Each pattern has its own characteristics, influencing factors, and ideal market conditions. Understanding not just the shapes but the context in which they form can improve a trader’s ability to interpret price action effectively.
How to Read Chart Patterns
Before you can spot opportunities, it helps to know exactly what you’re looking for.
Popular chart patterns like head and shoulders and double tops/bottoms appear repeatedly. The quicker you recognize these classic shapes, the faster you can act.
Here are three tips to help you spot them early:
- Scan charts regularly
Frequent exposure to charts will train your eyes to recognize emerging patterns faster, giving you an edge before others spot the same setup. - Draw simple trend lines
Connect highs (resistance) or lows (support) to clearly see emerging patterns. Even basic trend lines can reveal hidden setups. - Zoom out for perspective
Sometimes the clearest signals appear when you step back and view a longer timeframe. Patterns that seem unclear up close become obvious with a broader perspective.
Chart patterns aren’t about perfect shapes or geometry. They’re about understanding the psychology behind market moves. In other words: don’t treat patterns as a geometry exam. Instead, use them to quickly gauge whether recent price movements suggest buyers or sellers are in control.
How to Trade Chart Patterns
Spotting Chart Patterns gives traders a statistical edge by allowing them to anticipate future market movements more accurately. This advantage is based on historical data showing that certain patterns in price movements have consistently led to specific outcomes.
While the trading scenario associated with the chart pattern is not certain, it is more likely to be valid than random guessing. Therefore, with suitable risk management rules, chart pattern analysis can increase the likelihood of making profitable decisions, particularly when combined with sound risk management practices.
To technical analysts and chartists, each shape and pattern provides:
- a sense of whether you should enter a buy or sell position.
- a price level for that entry position.
- a theoretical price target of where to place your take-profit order.
- a theoretical price target of where to place your stop-loss order.
Some chart shapes and patterns have several price points for entering a position and more or less aggressive price objectives. Traders can modify these (or not) according to their own strategy.
Example of a double-bottom trade
In this example, the IBEX 35 index forms a double bottom shape (in black).
The double bottom pattern testifies to the waning nature of the initial bearish push, which fails to break through the support level despite two attempts. In the end, a new upward trend emerges.
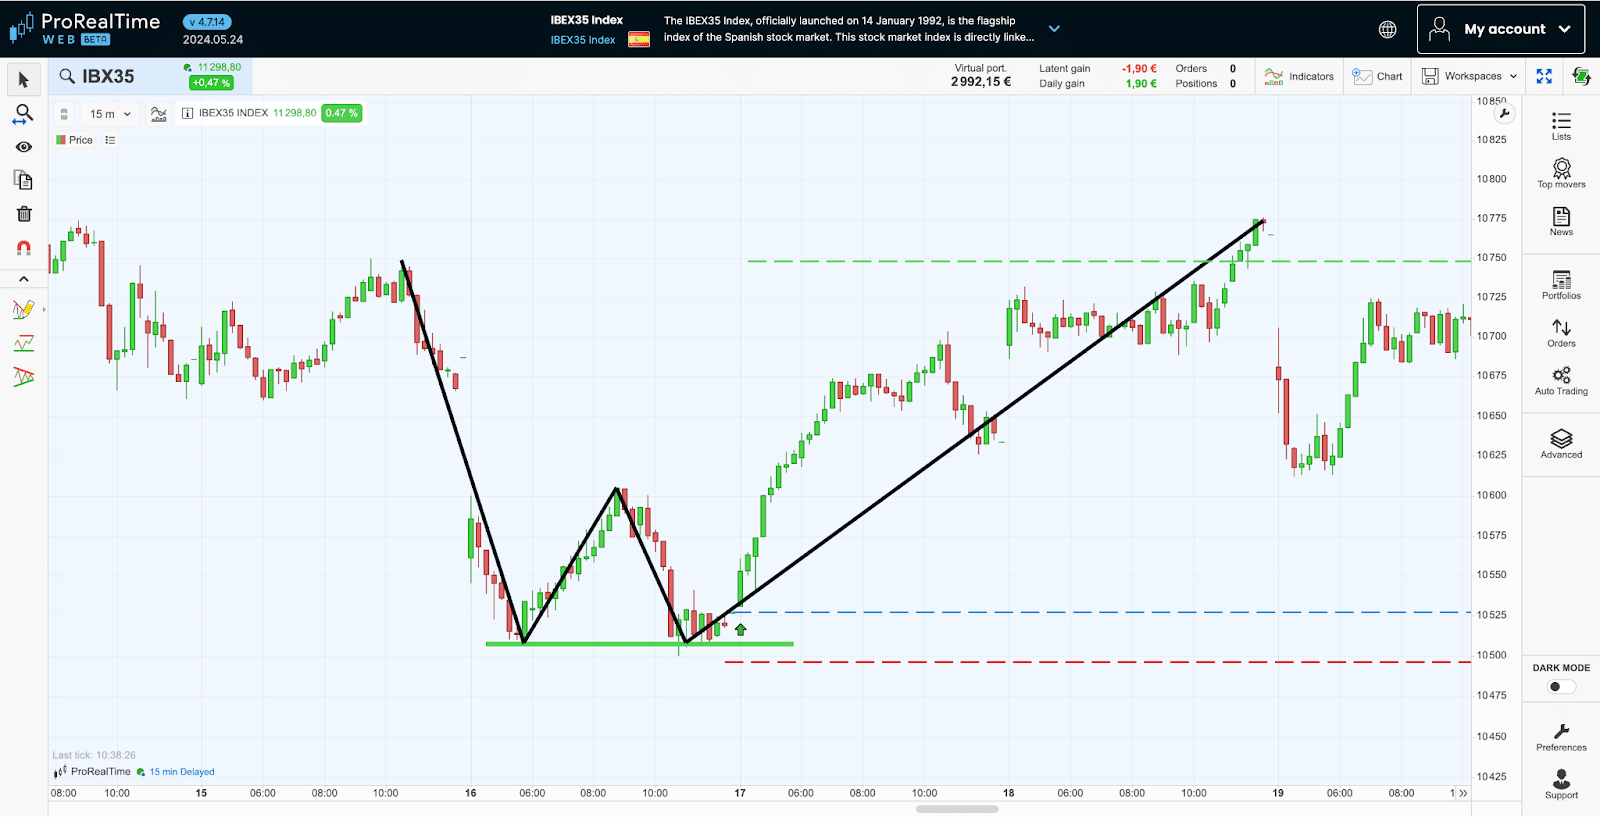
Technical analysis, suggests taking advantage of the double bottom pattern and buying after the security reaches the second support level, as indicated by the blue dotted line and the green arrow.
Then, you should place a stop-loss under the support at the red dotted line and place a take-profit order at the end of the “W” at the green dotted line.
Advantages and Disadvantages of Chart Pattern Analysis
| Advantages | Disadvantages |
|---|---|
| A versatile method This applies to any security, regardless of time scale. | A controversial method The predictive capacity of chart patterns and the statistical benefits claimed are the subject of heated debate within the financial community. |
| Simple trading signals Each shape offers a comprehensive theoretical trading plan for entry and exit positions. | Sometimes complex in practice The reality of the markets very rarely respects the purity of geometric theory. Identifying and exploiting a chart pattern requires trading experience. |
FAQ
What is the most successful chart pattern?
No single chart pattern is consistently superior. Each pattern offers potential insights, but their effectiveness depends on market conditions and the trader’s interpretation.
Do chart patterns really work in trading?
Yes, chart patterns can be a valuable tool for traders. However, they are most effective when used in conjunction with other indicators.
How can I find chart patterns?
Chart patterns can be identified by visually analyzing price charts or by using technical analysis software with pattern recognition tools. Learning to recognize common patterns manually is also essential.
How many types of chart patterns are there?
There are dozens of chart patterns, but they can be broadly classified into three main types: continuation, reversal, and consolidation patterns.

Maxime holds two master’s degrees from the SKEMA Business School and FFBC. As founder and editor-in-chief of NewTrading.fr, he writes daily about financial trading.


7 Popular Swing Trading Strategies with Practical Examples


The Most Popular Chart Patterns in 2026