Support and Resistance Indicators: How To Find Them?


Support and resistance levels represent key price zones where market activity often changes direction, giving traders valuable clues about future movements.
Whether you’re new to trading or just looking for a clear explanation, this guide will break down the basics of support and resistance. You’ll learn what they are, why they matter, and how to identify them—both manually and with the help of tools.
By the end, you’ll have a solid foundation to start applying these concepts in your trading. Let’s dive in.
Support and resistance levels are key price points that can help you buy or sell securities at the best price.
A support level is a low price zone offering a purchase opportunity. Conversely, a resistance level is a high price zone offering a sales opportunity.
Investor psychology and behavior play a key role in shaping support and resistance levels.
You can study historical stock data to identify support and resistance levels using chart pattern analysis and technical indicators.
What is a support level?
A support level is a price zone where a falling price is likely to stop, bounce back, or reverse direction. It acts as a floor, where buyers step in and outnumber sellers, preventing the price from dropping further.
By definition, support is always below the current market price. It’s a key level that signals where demand may start to outweigh supply, creating an opportunity for the price to stabilize or rise.
What is a resistance level?
A resistance level is a price zone where a rising price is likely to slow down, stop, or reverse direction. It acts as a ceiling, where sellers gain the upper hand over buyers, preventing the price from going higher.
Resistance is always above the current market price. It’s an important level that shows where supply may start to outweigh demand, causing the price to hesitate or fall.

By convention, support levels are shown in green, and resistance levels in red. Stock market charts generally have several support and resistance levels that are major and to a certain extent, distant from the current price.
Understanding support and resistance levels
Support and resistance levels are closely connected. When a price breaks above a resistance level, that level often becomes a new support. Similarly, when a price falls below a support level, it can turn into a new resistance.
These levels aren’t random. They form because traders often make decisions around key price points—whether it’s a historical high, low, or a round number. These decisions are often influenced by technical analysis, creating predictable patterns.
The strength of a support or resistance level depends on how many traders recognize and act on it. The more investors focus on a specific level, the stronger and more reliable it becomes.
The more times a key price point has been tested and validated by the market, the stronger it is considered to be. But beware, no support or resistance level is a sure thing!
Identifying the different types of support and resistance levels
Three methods of analysis help to identify support and resistance levels:
- Behavioral analysis
- Chart pattern analysis
- Technical indicators
Used separately or together, these methods of analysis help to identify different types of support and resistance levels, such as horizontal, oblique, or dynamic.
Horizontal support and resistance levels
Horizontal support and resistance levels correspond to fixed price levels which appear on the charts as horizontal lines.

| Support and resistance indicators | How It Works / Example |
|---|---|
| Extreme points | Recent highs and lows where the price reversed. Example: A stock’s peak at $150 acting as resistance. |
| Round numbers | Psychological levels traders focus on. Example: Dow Jones at 40,000 or a stock at $100. |
| Historical benchmark | Important past levels like IPO prices or price gaps. Example: A stock’s IPO price of $30 serving as support. |
| Fibonacci levels | Key retracement or extension levels based on Fibonacci sequences. Example: Price stalls at 61.8%. |
| Pivot point | Levels calculated using the previous session’s high, low, and close. Example: Pivot at $120, S1 at $115, R1 at $125. |
Oblique support and resistance levels
Oblique support and resistance levels correspond to fixed price levels shown on the charts as ascending or descending lines.

| Identification method | Examples |
|---|---|
| Trend lines | The last extreme high points of a trend for resistance or the last low points for support. |
| Chart Patterns | Canals, bevels, pennants, flags, and other popular chart patterns. |
| Drawing tools | Speedline, Andrew’s Pitchfork, Gann’s Fan, and other popular drawing tools. |
Oblique support and resistance levels are characterized by a steady slope, but their price levels changes over time, either upwards (upward support and upward resistance) or downwards (downward support and downward resistance).
Dynamic support and resistance levels
Dynamic support and resistance levels correspond to variable price levels shown on the charts as curves and technical indicators.

| Identification method | Examples |
|---|---|
| Moving averages | Simple, exponential, triangular, and other popular moving averages popular moving averages. |
| Donchian Canal | The Donchian channel’s upper resistance limit and its lower support limit. |
| Bollinger bands | The Bollinger bands’ upper resistance envelope and its lower support envelope. |
| Ichimoku | The different key levels of the Ichimoku indicator (Tenkan Sen, Kijun Sen, Chikou Span, and Cloud). |
Tracing the support and resistance levels
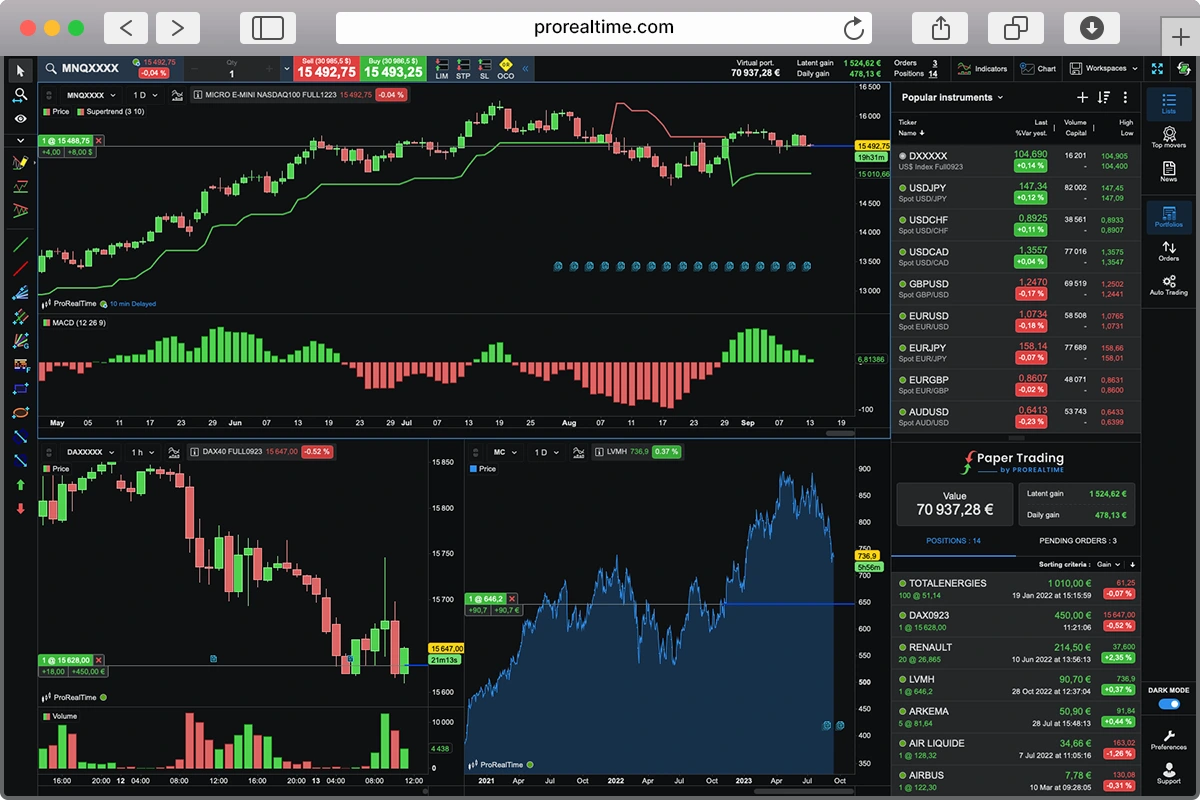
Support and resistance levels can be traced manually using drawing tools, and they can also be automatically detected using the best trading platforms.
To manually trace a support or resistance level, first identify the key market price point, then draw a line passing through these points.

To automatically trace the support and resistance levels, simply select a security and click the auto trace button.

Trading support and resistance levels
To correctly interpret the support and resistance levels, the accuracy of the levels is not as important as the investor behavior analysis regarding the levels.
Due to market noise, it is indeed relatively common for prices to briefly dip below a support level or rise above a resistance level without being significantly impacted.
Rather than trading support and resistance levels exactly at their price points, traders play it safe, remaining a good distance from these key points so as not to fall victim to random short-term movements.
Traders can consider two opposite strategies when confronted with support and resistance levels: fade and breakout trading.
Fade trading strategy
The strategy behind fade trading (or fading) is to bet on the strength of a support or resistance level.
In a buy-sell situation, traders place a buy order near the support level, a stop-loss order just after it, and a take-profit order just before the next resistance level.

In the case of a short sale, traders place a sell order near the resistance level, a stop-loss order just above, and a take-profit order just above the next support level.

Traders often use limit orders to buy on a support level or sell on a resistance level to optimize the accuracy of their entry point.
Breakout strategy
The idea behind a breakout strategy is to bet that prices will accelerate once a security crosses the resistance level or breaks through the support level.
In a buy-sell situation, traders place a buy order once the security breaks through and crosses the resistance level, a stop-loss order just below, and a take-profit order near the next resistance level.

In a short-sale situation, traders place a sell order once the security breaks through the support level, a stop-loss order just above the support level, and a take-profit order near the next support level.

Traders often use stop-loss orders to buy after a security crosses the resistance level or to sell after it breaks through the support level.
Traders rely on several factors to determine whether to bet on the strength or failure of a key price level:
- The underlying trend
By definition, with a bullish underlying trend, support levels are more robust than resistance levels. Conversely, with a bearish underlying trend, resistance levels are more robust than support levels. - Volumes
The increase in volume near support and resistance levels demonstrates that the market is interested in this key level. This price is unlike any other, which could encourage the market to take a break.
- The resilience of the tested level
The more successful a price level has been in the past, the more investors tend to trust it. But beware, if prices have more and more difficulty bouncing back near a support level or receding near a resistance level, they could collapse sooner or later.
- Technical indicators
Several indices can predict whether or not a key price level will be crossed, including those that measure the strength of a trend, price volatility, and price amplitude. In an attempt to guess whether support and resistance levels will be crossed, traders often use technical indicators.
Buy support levels and sell resistance levels as part of a fade trading strategy. Or, buy securities crossing resistance levels and sell securities breaking through support levels as part of a breakout strategy. This is one of a trader’s biggest dilemmas.
Fade trading or breakout trading? Before you choose a side, take advantage of some risk-free training on one of the best trading simulators!

Maxime holds two master’s degrees from the SKEMA Business School and FFBC. As founder and editor-in-chief of NewTrading.fr, he writes daily about financial trading.


7 Popular Swing Trading Strategies with Practical Examples


The Most Popular Chart Patterns in 2026