Double Bottom Patterns: Overview and How to Trade

Double bottom patterns are arguably a short seller’s most dreaded trading signal. This “W” shaped reversal chart pattern is a harbinger of an upcoming price increase. It marks the end of a downtrend and the beginning of an uptrend.
Double bottom patterns are among the most popular chart patterns. Traders use them to take profits or open new buying positions.
Knowing how to spot double bottom patterns quickly can help you identify key market price levels and fine-tune your trading plans.
Double bottom patterns are bearish reversal patterns that display price movements in the shape of a “W” or a double bottom.
The two bottoms of a double bottom chart pattern form once prices reach the support level. The high point between the two bottoms represents the neckline of the double bottom pattern from which you can calculate a theoretical price target.
Double bottom patterns encourage investors to close their selling positions, or open buying positions, betting that prices will rise.
What are double bottom patterns?
Double bottom patterns are bullish reversal patterns that resemble a “W” once they reach a support level.
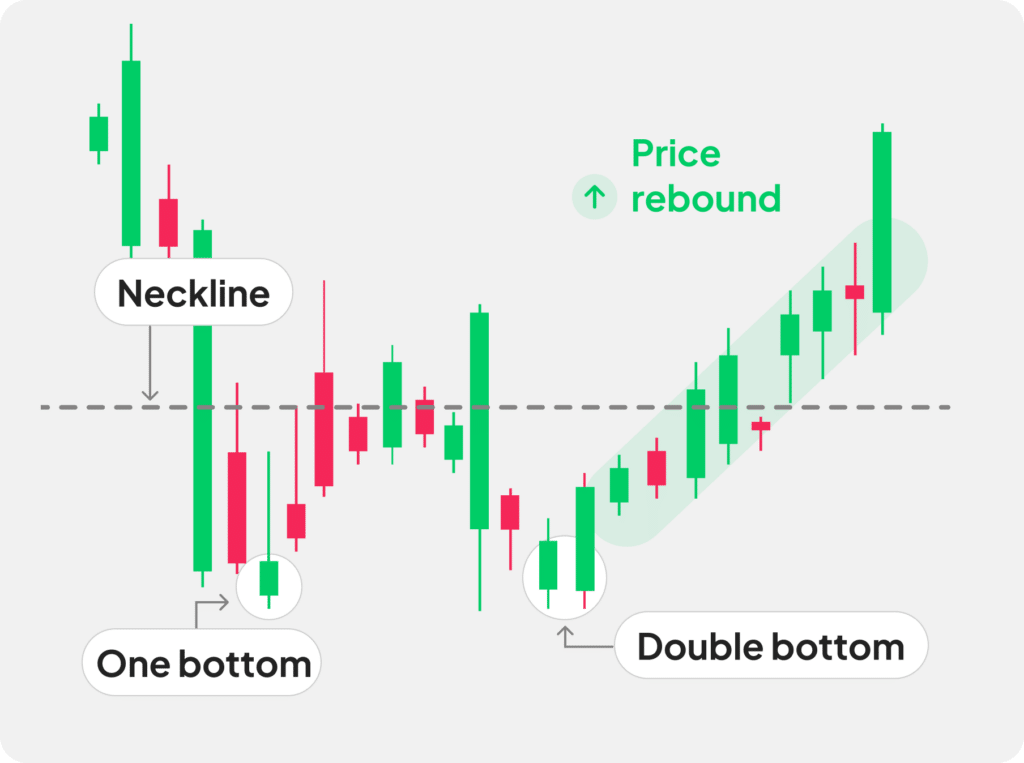
In a downward trend, prices draw a first bottom before rebounding. Then, the downtrend resumes, but this new attempt loses steam at the same level as the previous downtrend. Again, prices rebound, forming a second bottom similar in size to the first bottom.
However, the downtrend is blocked at the support level, indicating that prices are now more favorable to buyers than sellers. Prices rebound to a level between the two bottoms, referred to as the neckline.
The double bottom chart pattern and its bullish signal are validated once prices cross the neckline resistance level. The theoretical price increase is then calculated by adding a distance, from the neckline, equivalent to the distance between the support level and the resistance level.
The double bottom chart pattern and its bullish signal would be invalidated if prices were to break through the support level represented by the double bottom pattern’s two bottoms.
If prices bounce off the support level a third time, the pattern is called a triple bottom.
Identifying double bottom patterns
| Features | Explanations |
|---|---|
| Previous downtrend | Before double bottom patterns take shape, prices trend downward with increasingly lower lows and increasingly lower highs. |
| Two bottoms at the same level | The downward trending prices fail to break through (bounce off) the support level during two consecutive attempts. |
| Neckline | Between the two bottoms, prices rebound and form a temporary resistance level called the neckline. After the second bottom, note that prices cross the neckline resistance level. This confirms that you have a double bottom chart pattern. The neckline is critical as it validates the pattern and is used to determine the theoretical price target, which is calculated by adding a distance, from the neckline, equivalent to the distance between the support level and the resistance level. |
| Time scale | The double bottom chart pattern can be identified on any time scale. Depending on the trading horizon, the duration between the two bottoms can be as much as a few minutes to a few weeks. |
| Volume | Traders often look for increases in trading volume once prices reach the support level and then again when prices cross the neckline resistance level. |
Steps to spot double bottom patterns:
1 – Identify a downward trend.
2 – Draw a support level after the first bottom forms.
3 – Look for a second bottom indicating that prices have failed to break through the support level.
4 – If that second bottom forms and prices fail to break through the support level, verify that prices crossed the neckline resistance level, passing the high point between the two bottoms, thus validating that you indeed have a double bottom chart pattern.
If prices were to break through the support level, the double bottom pattern would be invalidated.
How to trade double bottom patterns
In line with chart pattern principles, when prices rise above the neckline resistance level, traders should place a stop-loss order below the support level and a take-profit order at a distance, from the neckline, equal to the distance between the support level and neckline resistance level.
Other more aggressive or more conservative strategies may be available depending on your risk tolerance.
| Strategy | Conservative | Aggressive |
|---|---|---|
| Position | Buyer | Buyer |
| Entry point | Once prices cross the neckline resistance level | Once prices fail to break through (bounce off) the support level for the second time |
| Stop-loss | Below the support level | Below the support level |
| Take-Profit | At a distance, from the neckline, equal to the distance between the support level and the neckline resistance level | At the starting point of the previous downtrend |
Example of double bottom pattern
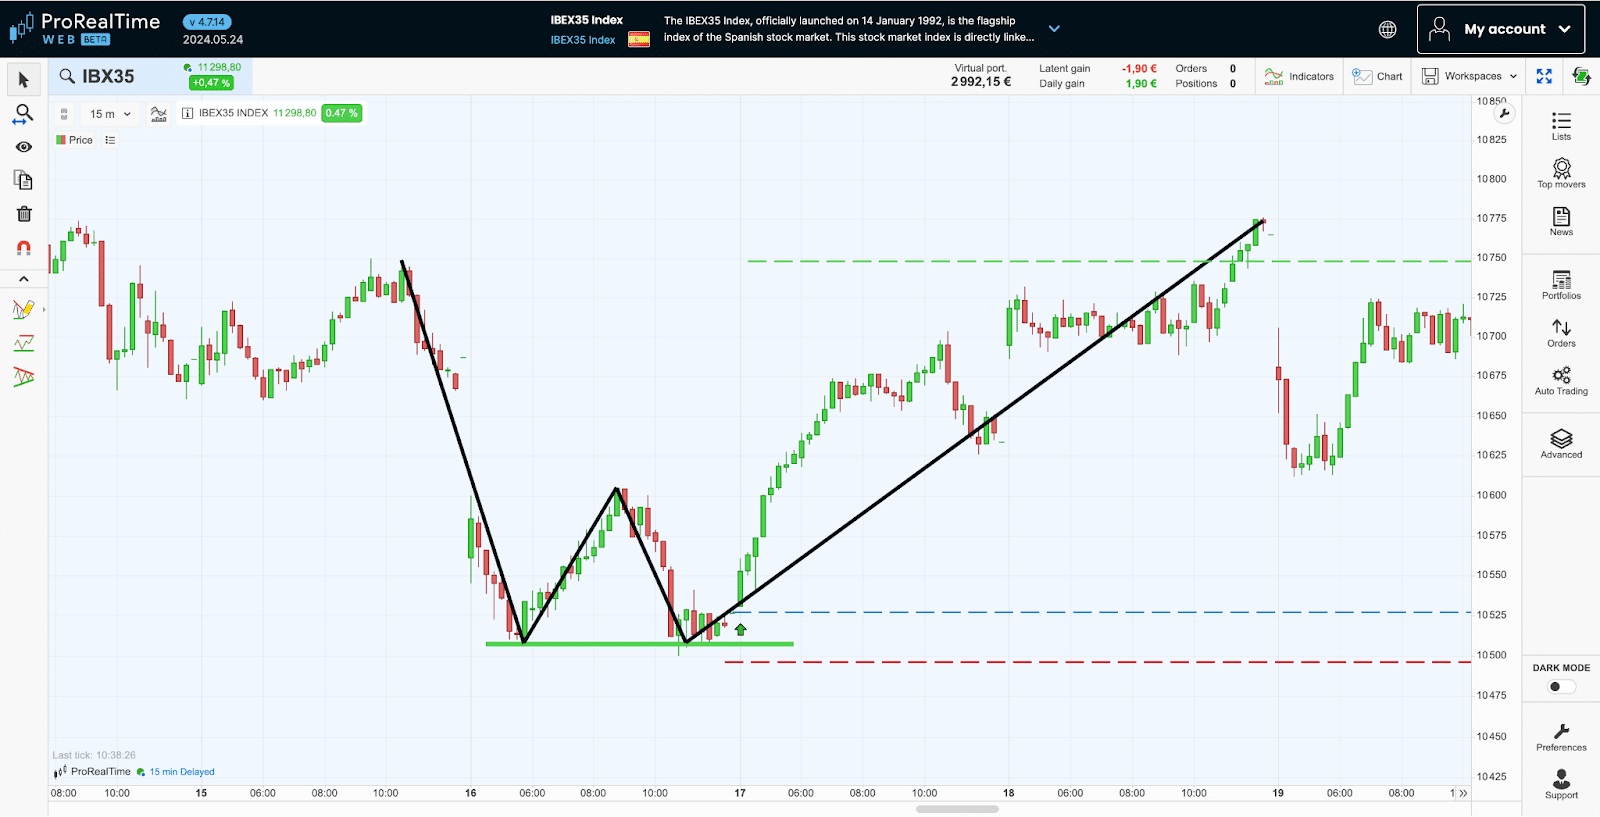
In this example, IBEX 35 forms a double bottom pattern (in black).
Chart theory would suggest taking advantage of it by buying at the blue dotted line, placing a stop-loss order at the red dotted line under the support level indicated by the continuous green line, and then placing a take-profit order at the end of the “W” at the green dotted line.
What happens after a double bottom pattern?
Double bottom patterns are not a sure thing, and their presence alone is insufficient to provide traders with a significant statistical advantage. Therefore, double bottom chart patterns should be interpreted more broadly.
Furthermore, the accuracy of double bottom patterns is often imperfect. In fact, it is common to see a second bottom slightly higher or lower than the first due to market noise.
Double top patterns vs. double bottom patterns: What’s the difference?
Double top patterns are the exact opposite of double bottom patterns. In other words, double top patterns are bearish reversal patterns that take the shape of an “M” once they reach the resistance level.
While double bottom patterns send a buyer signal at the end of a downtrend, double top patterns send a seller signal at the end of an uptrend.
Double bottom patterns are rarely perfectly geometric. Therefore, it can take a little time and practice to be able to identify them.
Consider using one of the best trading simulators to teach yourself to trade double bottom patterns without risk.

Maxime holds two master’s degrees from the SKEMA Business School and FFBC. As founder and editor-in-chief of NewTrading.fr, he writes daily about financial trading.


7 Popular Swing Trading Strategies with Practical Examples


The Most Popular Chart Patterns in 2026