Inverted cup and handle patterns: Overview and How to Trade

Inverted cup and handle patterns are arguably the most appreciated sell trading signals. These continuation patterns resemble an inverted coffee cup and are a harbinger of falling prices.
Inverted cup and handle patterns are among the most popular patterns. Traders use these patterns to take a sell position during downtrends.
Knowing how to spot inverted cup and handle patterns quickly will help you identify key market price levels and fine-tune your trading plans.
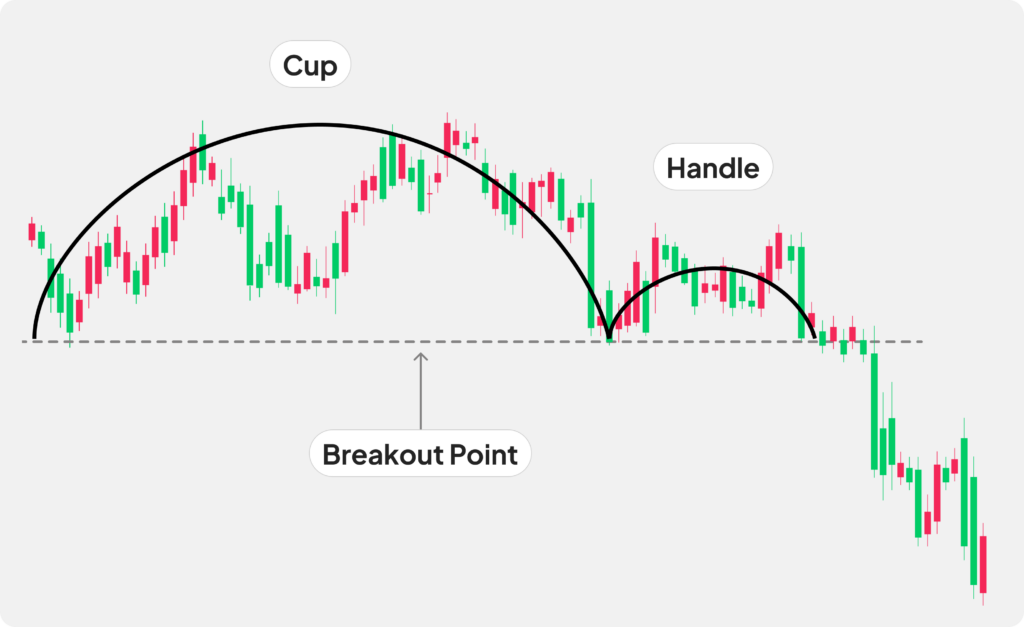
Inverted cup and handle patterns are bearish continuation patterns that consist of a large initial peak (the inverted cup) followed by a smaller peak (the inverted handle) once they reach a support level.
The inverted cup and handle pattern is validated when the price breaks below the support level formed by the low points of the cup and handle. This breakout confirms the bearish signal, indicating a potential continuation of the downtrend.
The formation of these inverted cup and handle patterns encourages investors to sell and buyers to take profit.
What are inverted cup and handle patterns?
Inverted cup and handle patterns are bearish continuation patterns that consist of a large initial peak (the inverted cup) followed by a smaller peak (the inverted handle) once they reach a support level.
In the course of a downward trend, prices draw a first low point before rebounding. Then, the downward trend resumes, but this new attempt loses steam at the same level as the previous downtrend. Again, prices rebound, forming a second low at the same level as the first.
However, the downtrend is blocked at the support level, indicating that prices are now more favorable to buyers than sellers. The peak between these first two low points forms the “inverted cup.”
After prices fail to break through the support level for the second time, prices briefly rebound but quickly return to the support level. This second smaller peak forms the “inverted handle.”
The pattern is confirmed as bearish when the price breaks through the support level after the formation of the handle. This break signifies the completion of the inverted cup and handle pattern and suggests further downward movement.
The theoretical price target for the downtrend is calculated by measuring the vertical distance between the high point of the inverted cup and the support level. This distance is then projected downward from the support level to estimate the potential decline.
On the other hand, the pattern and its signal are invalidated if, after breaking through the support level, prices rebound again and pass above the low point of the “inverted handle” (the support level).
Identifying inverted cup and handle patterns
| Features | Explanations |
|---|---|
| Previous downtrend | Before inverted cup and handle patterns form, prices trend downward with increasingly lower lows and highs. |
| Support level | The downward trending prices fail to break through (bounce off) the support level during three consecutive attempts. |
| Formation of the inverted cup | The peak between the first two low points represents the “cup.” |
| Formation of the inverted handle | The peak formed following the second low point represents the “handle” of the cup. |
| Time scale | Inverted cup and handle patterns can occur on any time scale. Depending on the trading horizon, the duration of the cup and its handle can be a few minutes or weeks. |
| Volume | Traders often look for increased trading volume once prices reach the support level and then again when prices break through it. |
Steps to spot inverted cup and handle patterns:
1 – Identify a prior downward trend.
2 – Note the formation of two low points at the same level.
3 – After the second low point, note the formation of a peak (the inverted handle), which is smaller than the first peak (the inverted cup).
4 – Verify that prices have broken through the support level after the handle has formed. This confirms that you have an inverted cup and handle pattern and its sell signal.
Trading inverted cup and handle patterns
Traders usually bet that prices will continue to fall once they break through the support level. A stop-loss order is placed above the handle, and a take-profit order is placed below the support level at a distance equal to the height of the cup.
| Position | Sell |
| Entry point | Once prices break through the support level |
| Stop-loss | Above the high point of the inverted handle |
| Take-Profit | Below the support level at a distance equal to the distance between the top of the cup and the support level |
Example of an inverted cup and handle pattern

In this example, STARBUCKS’ stock price forms an inverted cup and handle pattern. The rounded downward curve (in black) represents the inverted cup, while the smaller upward retracement (in blue) forms the handle. After completing the pattern, the price breaks below the horizontal support level (in red), confirming the bearish signal.
What happens after these inverted cup and handle patterns?
Inverted cup and handle patterns are not infallible and their presence alone is insufficient to provide traders with a significant statistical advantage. Therefore, they should be interpreted more broadly.
Furthermore, the accuracy of inverted cup and handle patterns is often imperfect. In fact, it is common to see the second low point slightly higher or lower than the first due to market noise.
Inverted cup and handle pattern vs cup with handle pattern: What’s the difference?
The cup with handle pattern is the exact opposite of the inverted cup and handle pattern.
The cup with handle pattern is the bullish counterpart to the inverted cup and handle. It consists of a rounded upward curve (U cup) followed by a brief downward retracement (the handle). This pattern suggests a continuation of the uptrend once the price breaks above the resistance level.
While inverted cup and handle patterns send a down-trending sell signal, cup with handle patterns send an up-trending buy signal.
Inverted cup and handle patterns are rarely perfectly geometric. Therefore, it can take a little time and practice to be able to identify them.
Consider using one of the best trading simulators to teach yourself how to trade inverted cup and handle patterns without risk.

Maxime holds two master’s degrees from the SKEMA Business School and FFBC. As founder and editor-in-chief of NewTrading.fr, he writes daily about financial trading.


7 Popular Swing Trading Strategies with Practical Examples


The Most Popular Chart Patterns in 2026