Trading Head and Shoulders Patterns

Head and shoulders patterns are among the most popular chart patterns in technical analysis.
These reversal chart patterns, which resemble a head flanked by two shoulders, often indicate an imminent decline in prices. Traders leverage head and shoulders patterns to identify potential profit-taking opportunities and to place bets on declining prices at the end of an uptrend.
Knowing how to spot head and shoulders patterns quickly will help you identify key market price levels and fine-tune your trading plans.
Head and shoulders patterns are bearish reversal patterns consisting of a middle peak (the head) and two peaks to either side (the shoulders).
The two low points between the head and shoulders represent the neckline. The neckline support level is used to calculate the theoretical downside price target, which is obtained by subtracting the distance between the high point (the head) and the neckline support level (the low point of either shoulder) from the neckline breakout level.
Head and shoulders patterns can encourage investors to buy and short sellers to take profits.
What are head and shoulders patterns?
Head and shoulders patterns are bearish reversal patterns consisting of three consecutive peaks, with the middle peak (the head) rising slightly above the two peaks to either side (the shoulders).
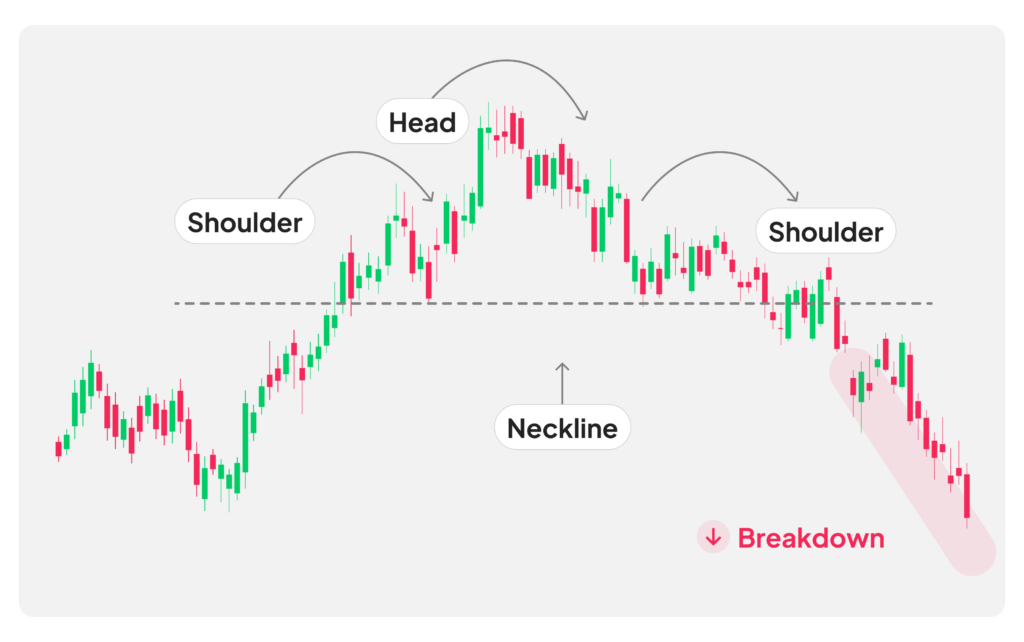
These patterns demonstrate a gradual inversion of the power relationship between buyers and sellers with the uptrend slowing down. This means that the second shoulder does not manage to exceed the last high recorded by the head.
As part of an upward trend, prices draw a first high point before falling back to the support level. This first peak represents the left shoulder. Then the uptrend picks up again, and prices manage to draw a second higher point, which is the head.
Prices then return to the first low point (support level) between the first two high points, which is called the neckline.
But the uptrend loses steam and upward price momentum is blocked by the resistance level represented by the top of the first shoulder. A third and final peak draws the right shoulder.
The bearish signal of a head and shoulders pattern is confirmed when prices continue to decline after breaking below the neckline, the support level connecting the two troughs between the shoulders and the head.
The theoretical downside price target is obtained by subtracting the distance between the high point (the head) and the neckline support level (the low point of either shoulder) from the neckline breakout level.
On the other hand, the pattern and its signal are invalidated if, after breaking through the neckline support level, prices trend upward again and pass the second shoulder’s high point.
How to identify a head and shoulders pattern
| Features | Explanations |
|---|---|
| Prior upward trend | Before head and shoulders patterns take shape, prices trend upward with increasingly higher highs and increasingly lower lows. |
| Left shoulder | The first peak represents the left shoulder, which will be overtaken by the next bullish thrust. |
| Head | The second peak represents the head. It goes beyond the left shoulder’s high point. |
| Right shoulder | The third and final peak represents the right shoulder, which is usually similar in height to the left shoulder but can be slightly higher or lower. |
| Main resistance level | The middle peak (the head) is the pattern’s main resistance level. |
| Secondary resistance level | The two smaller peaks (the shoulders) represent the pattern’s secondary resistance level. |
| Neckline support level | The two low points to either side of the head are the support level, referred to as the neckline. |
| Time scale | Head and shoulders patterns can take place on any time scale. The duration of the pattern can be a few minutes or weeks, depending on the trading horizon. |
| Volume | Volume typically decreases during the formation of the right shoulder. Traders look for an increase in volume when the price breaks below the neckline, confirming the pattern. |
Steps for spotting head and shoulders patterns:
1 – Ensure there is a clear upward trend leading up to the formation of the pattern.
2 – Spot three consecutive peaks, with the middle peak (head) being higher than the two flanking peaks (shoulders).
3 – Draw a line connecting the low points (neckline) between the head and shoulders.
4 – A valid head and shoulders pattern is confirmed when the price breaks below the neckline after the formation of the right shoulder.
How to trade head and shoulders patterns
Traders usually bet that prices will continue to fall once they break through the neckline support level. A stop-loss order is placed above the resistance level represented by the shoulders’ high points, and a take-profit order is placed between the high point (the head) and the neckline support level.
| Position | Sell |
| Position entry point | After prices break through the neckline support level. This helps avoid false signals. Consider using a 1-2% break below the neckline as a trigger to enter the trade. |
| Stop-loss | Above the second shoulder’s high point. |
| Take-Profit | Between the high point (the head) and the neckline support level. |
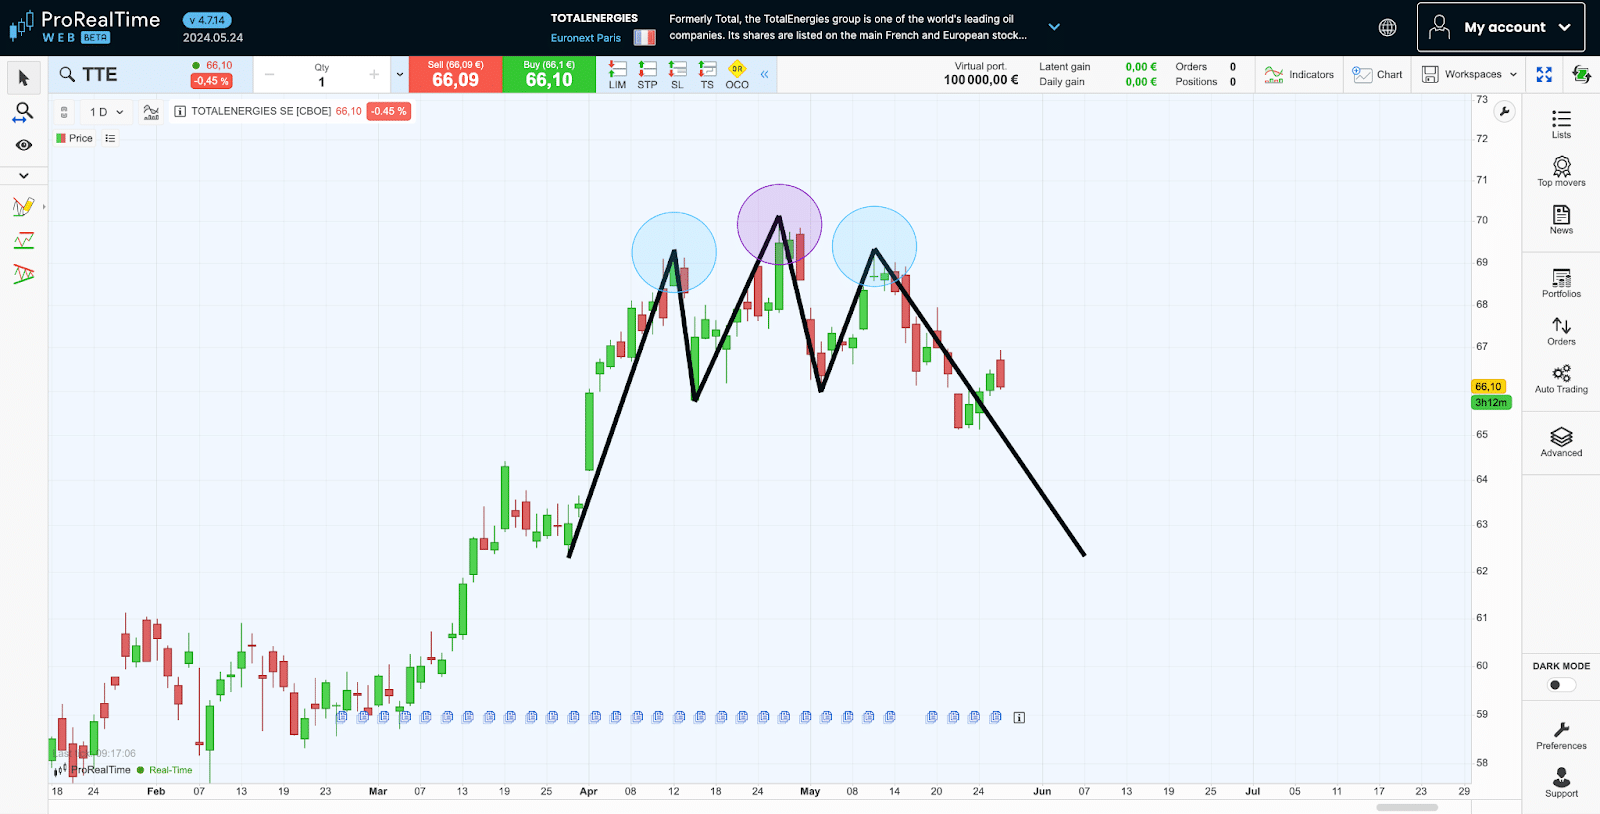
Example of a head and shoulders pattern
The probability of success for head and shoulders patterns
A head and shoulders patterns is not a sure thing (far from it) and its presence alone is insufficient to provide traders with a significant statistical advantage. Therefore, head and shoulders patterns should be interpreted more broadly.
Furthermore, the accuracy of head and shoulders patterns is often imperfect. In fact, it is common to see a second shoulder slightly higher or lower than the first due to market noise.
Inverse head and shoulders patterns: How do they differ from head and shoulders patterns?
Inverse head and shoulders patterns are the exact opposite of head and shoulders patterns.
In other words, inverse head and shoulders patterns are bullish reversal patterns consisting of three consecutive troughs with the middle trough (the inverted head) falling below the two troughs to either side (the shoulders).
While head and shoulders patterns send a sell signal at the end of an uptrend, inverse head and shoulders patterns send a buy signal at the end of a downtrend.
Head and shoulders patterns are rarely perfectly geometric. Therefore, it can take a little time and practice to be able to identify them.
To master trading head and shoulders patterns, consider practicing with a trading simulator. This allows you to hone your skills and strategies without financial risk, ensuring you are well-prepared for real-market conditions.

Maxime holds two master’s degrees from the SKEMA Business School and FFBC. As founder and editor-in-chief of NewTrading.fr, he writes daily about financial trading.


7 Popular Swing Trading Strategies with Practical Examples


The Most Popular Chart Patterns in 2026