What’s the Best Time Frame for Trading? A Practical Guide


Markets can be tricky: bearish on a 5-minute chart, bullish on a daily chart, and completely flat on a monthly chart. That’s why understanding how to choose the right time frame is so important.
This guide breaks down time frames for day trading, swing trading, and long-term positions. I’ll also share insights on how multi-timeframe strategies can help you approach the markets with more clarity.
Let’s dive in.
Day traders gravitate toward 1- to 15-minute charts to seize quick price movements and capitalize on short-term opportunities.
Swing traders lean on daily and 4-hour charts to identify broader market trends and hold positions over several days or weeks.
Multi-time frame analysis refines decision-making by combining higher time frames to confirm trends with lower time frames for precise entries.
Align your time frame with your trading strategy—short for intraday moves, long for sustained trend shifts.
Short time frames magnify detail but include more noise, while longer frames smooth out fluctuations, providing clearer trends with fewer trading signals.
Understanding Time Frames in Trading
A time frame is the interval your chart uses to display price movements—whether it’s 1 day, 1 hour, 1 minute, or as granular as seconds or ticks.
The time frame you select dictates how frequently your chart updates price data—connecting price points on a line chart,or forming candlesticks that represent price movements over the chosen time frame.
Much like a microscope, time frames determine how closely you examine price action.

Your time frame shapes how you read trading charts—and the chart patterns you rely on. On short time frames like the 2-minute chart, you’ll spot rapid breakouts and micro-trends, perfect for quick trades but prone to market noise.
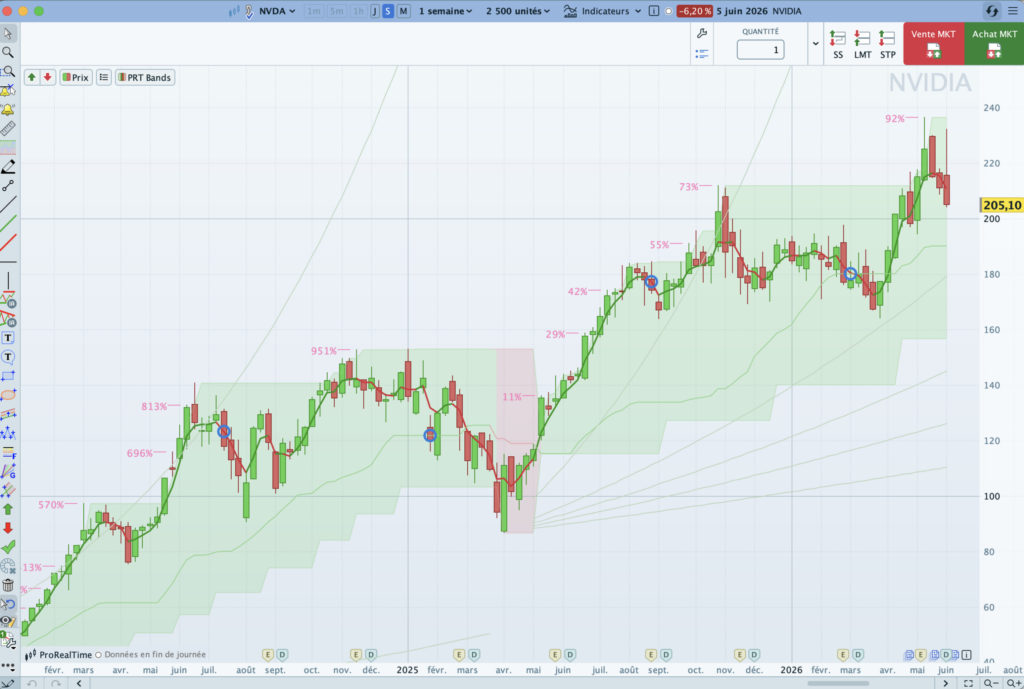
You can display any time frame over different historical ranges. For example, a 5-minute time frame can show the last 200 units (candles) or span several days, depending on the historical range you set.

The following chart, for example, displays the price action of the Micro E-mini Dow Jones Futures using a “5-minute” time frame and a history of “100 units.” Each one of these candlesticks represents price action within a 5-minute window, giving traders a clear view of the past 500 minutes in the market.

Choosing the Right Time Frame
From tick charts that capture every tiny movement to yearly charts that reveal long-term trends, time frames give you a different lens on the same price action.
The difference isn’t what you see—it’s how detailed the picture gets. Each time frame has pros and cons, so the best one for you depends on your trading style.
- Scalpers thrive on seconds or tick charts for rapid precision.
- Day traders focus on minute or hourly charts to capture intraday movements.
- Swing traders look to daily or 4-hour charts for sustained trends.
- Position traders prefer weekly or monthly charts to hold trades for weeks or longer.
A Practical Example
To see how this works in practice, imagine you’re a day trader looking to add longer-term context to your analysis.
You could start by using a 15-minute time frame to identify the overall trend and mark key support and resistance levels based on the past 2 days of price action (left chart below). Then, zoom into a 1-minute time frame (right chart) to refine your entries and exits using the levels you marked earlier.

This approach ensures you align your trades with the bigger picture while maintaining the precision needed for intraday trading.
Here’s an overview of the most commonly used time frames based on trading style:
| Timeframe | Scalping | Day trading | Swing trading | Position trading |
|---|---|---|---|---|
| Years | ❌ | ❌ | ❌ | ✅ |
| Month | ❌ | ❌ | ❌ | ✅ |
| Weeks | ❌ | ❌ | ✅ | ✅ |
| Days | ❌ | ❌ | ✅ | ✅ |
| Hours | ❌ | ✅ | ✅ | ❌ |
| Minutes | ✅ | ✅ | ❌ | ❌ |
| Seconds | ✅ | ❌ | ❌ | ❌ |
| Ticks | ✅ | ❌ | ❌ | ❌ |
Important: The preferences in the table above and throughout this article aren’t fixed rules. Think of them as starting points to guide you. Just like time frames offer different views of price action, you can adjust and experiment to find what works best for you.
How Chart Resolution Impacts Your Market View
The time frame you select on a candlestick chart dictates how much detail you see in each candle, shaping how you analyze price action and make decisions. Each candle reflects key data—open, close, high, and low prices—summarized over the chosen time interval.

For example, on a 1-hour time frame, a single candlestick condenses an entire hour of trading activity. Switch to a 15-minute time frame, and you’ll see four candlesticks for that same hour, each highlighting shorter-term fluctuations.
Here’s a side-by-side comparison of Dow Jones Future over the same 2-day period. The 1-hour chart (left) simplifies the broader trend, while the 15-minute chart (right) zooms in, revealing the intricate movements that make up those larger candles.

But here’s the thing: More detail doesn’t always mean better insights.
While shorter time frames provide a closer look at price action, they can make it harder to distinguish meaningful patterns from temporary fluctuations. This can lead traders to overanalyze minor moves that don’t reflect the overall market direction.
Here’s a breakdown of the key differences between shorter time frames (hours, minutes, seconds) and longer ones (days, weeks, months):
| Shorter time frames | Longer time frames | |
|---|---|---|
| What they show | Zoom in on price action, offering a detailed look at short-term trends and patterns. | Step back to see the bigger picture, filtering out noise to highlight overarching trends. |
| Signal reliability | You’ll see more signals, but smaller price fluctuations can easily trigger your stop-loss, cutting you out of trades that might’ve worked if you’d given them more room. | Longer time frames produce fewer signals, but these are often clearer and more reliable, as they reflect sustained price movements, reducing the chance of being misled by random noise. |
| How they feel | Fast-paced and intense, with rapid price movements requiring quick decisions and constant focus. | Slower and more methodical, allowing time to plan and think strategically. |
| Position size | Smaller price swings create fewer profit opportunities, often pushing traders to use leverage, which increases risk. | Broader trends may allow for the same profit target with smaller positions and less reliance on leverage, reducing overall risk |
When switching between time frames, you’ll notice that patterns and indicators don’t always look the same.
For example, a double bottom on a 1-hour chart can signal a clear trend reversal. But on a 5-minute chart, it may appear muddled—distorted by the constant price movements that smaller time frames reveal. This variability is why it’s crucial to layer your analysis across multiple time frames, confirming patterns on higher time frames before acting on what you see.
The same goes for technical indicators like RSI or MACD.

The Multi-Time Frame Approach
From Charles Dow’s theory of primary, secondary, and minor market movements to John J. Murphy’s technical analysis insights, many experts emphasize the value of analyzing markets across multiple time frames to refine trading decisions.
The principle behind this approach is straightforward. If a trading signal gives you an edge on one time frame, that edge becomes stronger when similar signals appear on higher and lower time frames.
Think of it this way:
- A buy or sell signal on a 15-minute chart becomes far more convincing when it aligns with signals on both the hourly and daily charts.
- On the flip side, conflicting signals across time frames—such as an upward trend on a daily chart but a bearish divergence on the hourly chart—should encourage caution.
Waiting for alignment across time frames can help you avoid chasing the wrong trend and instead trade with clarity.
This approach isn’t a magic formula, but it adds structure to your analysis. Even if the system doesn’t guarantee statistical perfection, it offers a crucial psychological edge.
By following the trend on your highest time frame, you avoid being whipsawed by fleeting market noise. And by waiting for precise entry signals on your lower time frame, you resist the fear of missing out (FOMO).
These systematic filters make it easier to establish disciplined money management rulesand reduce the emotional pitfalls—like overtrading or chasing losses—that can lead to significant setbacks.
The chart below shows how a multi-timeframe layout would look on your trading platform:

Ultimately, multi-time frame analysis is about using time frames as complementary tools rather than isolated views. By combining the clarity of longer time frames with the precision of shorter ones, you gain a more comprehensive picture of the market.
What is the Best Time Frame for Day Trading?
Day trading use shorter time frames—like minutes or hours—to track quick intraday movements, while daily charts help them stay aware of the overall trend.
Some day traders prefer a slower, more methodical pace, while others thrive on the adrenaline of rapid trades.
This table breaks down common time frames and how they suit different day trading styles:
| Day Trading Style | Short Time Frame | Medium Time Frame | Long Time Frame |
|---|---|---|---|
| Slow | 15 minutes | 1 hour | 1 day |
| Moderate | 5 minutes | 30 minutes | 4 hours |
| Fast | 2 minutes | 15 minutes | 1 hour |
Trading volatile assets like cryptocurrencies can feel like a rollercoaster in shorter time frames. Day traders often use slightly longer intraday time frames to smooth out the noise and spot patterns more clearly.
What is the Best Time Frame for Scalping
Scalping takes speed to the extreme, with trades often lasting mere seconds. Scalpers aim to profit from tiny price fluctuations through frequent trades. To keep up with the market’s pace, they rely on tick charts—the shortest time frame available—where each tick represents a single price change.
Different scalping styles call for different combinations of short, medium, and long time frames:
| Scalping Style | Short Time Frame | Medium Time Frame | Long Time Frame |
|---|---|---|---|
| Slow | 2 minutes | 15 minutes | 1 day |
| Moderate | 1 minute | 5 minutes | 4 hours |
| Fast | 25 ticks | 1 minute | 15 minutes |
Rather than traditional time frames, scalpers adjust their charts using the “number of ticks” to match market activity. In high-volatility periods, they increase the tick count to reduce screen clutter. During quieter periods, lowering the tick count per candlestick ensures more frequent updates.
Think of it as adjusting playback speed on a video: when the action is too fast, you slow it down for clarity. When it’s too slow, you speed it up to stay engaged. By fine-tuning tick settings, scalpers ensure their charts remain clear and actionable, no matter the market’s pace or intensity.
What is the Best Time Frame for Swing Trading?
Swing trading focuses on medium-term price movements, with trades lasting anywhere from a few hours to several days. As a result, swing traders rely on longer time frames compared to intraday traders, typically using charts based on hours, days, or even weeks.
| Swing Trading Style | Short Time Frame | Medium Time Frame | Long-Term Time Frame |
|---|---|---|---|
| Slow Pace | 1 hour | 1 day | 1 week |
| Moderate Pace | 15 minutes | 4 hours | 1 week |
| Fast-Paced | 5 minutes | 1 hour | 1 week |
Swing trading’s reliance on longer time frames means you don’t need to monitor the market constantly. This extra time allows for more thoughtful analysis and strategy development, making it an ideal approach for traders balancing other commitments.
What is the Best Time Frame for Position Trading?
Position trading focuses on long-term price movements, with trades lasting from several days to a few weeks.
Position traders rely on much longer time frames compared to other trading styles, often using charts based on days, weeks, or even months to identify and capitalize on sustained market trends.
| Position Trading Style | Short Time Frame | Medium Time Frame | Long Time Frame |
|---|---|---|---|
| Slow | 1 day | 1 week | 1 month |
| Moderate | 1 hour | 1 day | 1 month |
| Fast | 15 minutes | 1 day | 1 month |
Position traders often use fundamentals to spot opportunities in long-term trends on weekly or monthly charts. To complement this, they turn to daily or 4-hour charts to time their entries and exits, ensuring alignment with both the broader market direction and short-term price behavior.
How Much Price History Should You Display?
Choosing the right time frame is only part of the equation. Deciding how much price history to display on your charts can make all the difference in how effectively you trade.
Personally, I don’t see the need to display the entire history of the market on my charts. Instead, I focus on what’s most relevant: recent price movements. For me, the sweet spot is about balancing clarity and context.
Here’s how I approach it:
- Medium time frame
I make sure it shows my three key levels—my entry point, stop-loss, and take-profit. This keeps my chart focused on the practical details I need for the trade. - Long time frame
I use this to see when prices last traded near the current levels. It’s a great way to identify historical zones of support or resistance that could influence the market now.
For day trading and scalping, I always keep one chart dedicated to the current trading session and another for the previous session. Why? Because yesterday’s movements often leave clues—like key levels or patterns—that help me plan today’s trades. This setup gives me just enough context without overwhelming my screen.
To make things even easier on the eyes, I leave about 20% of my chart blank on the right-hand side. This avoids having the latest price action cramped against the edge, which helps me visualize potential price moves more comfortably.
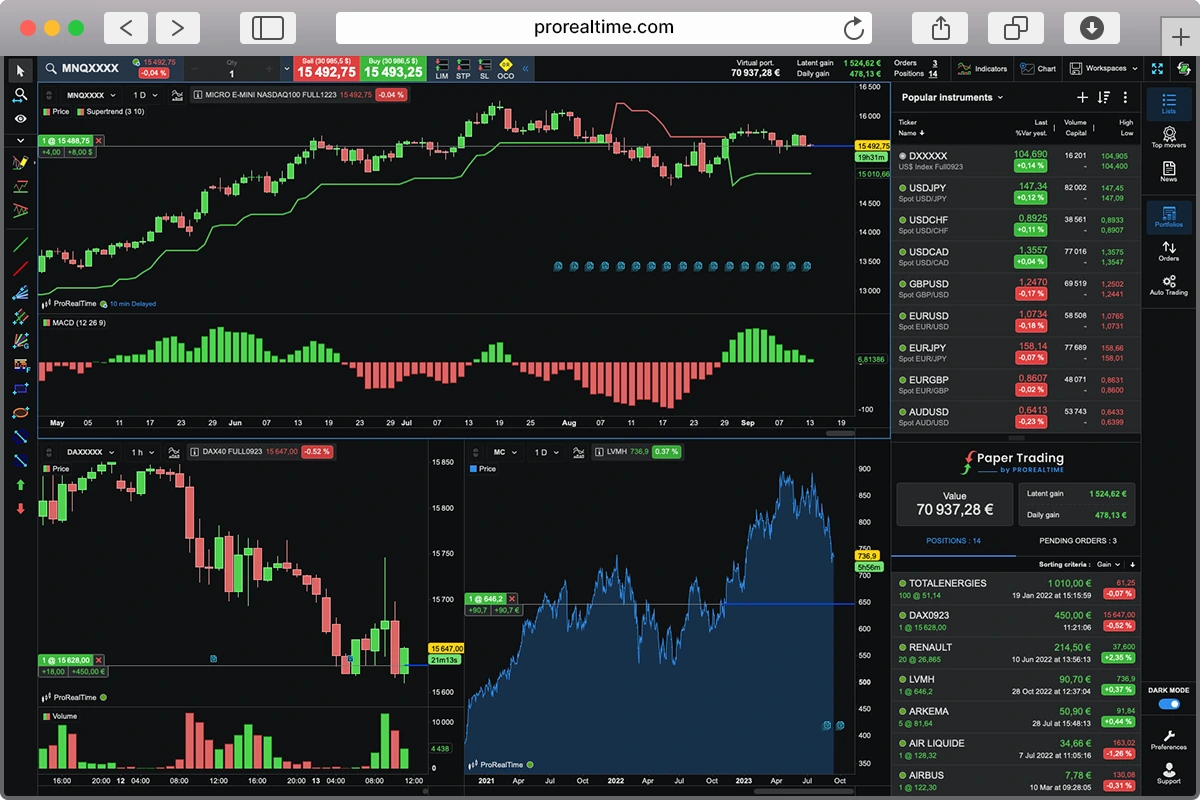
Use a trading platform that gives you access to deep historical market data. ProRealTime, for example, lets you review decades of price action, backtest strategies over meaningful periods, and even replay historic events in real time. This kind of flexibility is a game-changer when refining your strategy.
How to Change the Time Frame on Your Chart
The best charting software makes switching time frames quick and intuitive, usually with a toolbar or dropdown menu. ProRealTime, for instance, offers a clear layout with options to select your asset, favorite time frames (e.g., 25 ticks, 5 minutes, 1 hour, 1 day), and the number of units to display. Setting up your ProRealTime account allows you to customize time frames to suit your trading style.

To save time, set up your favorite time frames and create custom layouts for different trading styles. For example, you can create one layout for scalping Futures and another for swing trading on stocks. ProRealTime also lets you assign keyboard shortcuts or import layouts from the community, making it easy to switch between setups in seconds.

If you’re tracking multiple assets simultaneously, linking charts can be a real time-saver. Here’s how it works:
Imagine you’re monitoring EUR/USD, GBP/USD, and USD/JPY. Linking your charts ensures that when you switch one to a 4-hour time frame, the others update automatically. This keeps your analysis consistent across all assets and eliminates repetitive adjustments.
Final Thoughts
Choosing the right time frame is a foundational skill for any trader. It shapes how you view the market, from spotting micro-trends on minute charts to identifying long-term opportunities on weekly or monthly charts.
The key takeaway? Your time frame should align with your trading style.
Day traders thrive on quick shifts, scalpers rely on precision, swing traders focus on sustained trends, and position traders take a long-term view. No single time frame works for everyone, but experimenting with different setups—especially on a trading simulator—can help you find what works best for you.

Maxime holds two master’s degrees from the SKEMA Business School and FFBC. As founder and editor-in-chief of NewTrading.fr, he writes daily about financial trading.
Enjoy free trading practice on
ProRealTime Paper Trading Simulator.