How To Find Stocks To Day Trade: A Step-by-Step Guide


Day trading requires discipline—especially when deciding which stocks deserve your attention. So how do you filter thousands of stocks down to the ones worth your time?
This guide provides actionable steps to help you refine how to choose stocks for day trading.
Note: Use this information as a starting point—not as financial advice—and adapt it to suit your unique trading approach.
Day traders thrive on stocks withvolatility, volume, clearcatalysts, andliquidity—key ingredients for capturing meaningful intraday profit opportunities.
There’s no such thing as a perfect stock—day trading is about making informed decisions, managing significant risks, and learning from every trade.
Intraday price swings are essential for capturing profit, especially after accounting for transaction costs like fees,spreads,andslippage.
Scanners and watchlists help narrow thousands of stocks down to a focused watchlist of trading opportunities.
The stock you choose is only as good as the plan you build around it. A disciplined process beats luck every time.
Step 1: Select Stocks with Pre-Market Scanning
Intraday price movement is critical for day trading—without it, there’s no risk to take on and no opportunity to extract profit from the markets.
Therefore, your first step is to build a stock watchlist with the potential for significant intraday price moves.
When should you scan? Usually, a few hours before the market opens at 9:30 AM EST (if you’re day trading U.S. stocks). This is your chance to spot early momentum and narrow your focus to stocks with the highest potential for the day ahead.
For beginners, a great starting point is identifying top market movers—stocks already showing strong pre-market activity. These movers are often driven by catalysts like earnings, breaking news, or macro events.
Common catalysts to look for:
| Catalyst | Example |
|---|---|
| Earnings reports | A tech company beats estimates by 15%, causing a 10% pre-market gap up. |
| FDA approvals | A biotech firm jumps 25% after FDA approval of its new cancer treatment. |
| Industry trends | Renewable energy stocks rally after new subsidies are announced. |
| Short squeezes | A retail stock surges 40% intraday as short sellers unwind their positions. |
| Top management changes | A new CEO with turnaround expertise drives a 12% rally, while a CFO resignation triggers a 10% selloff. |
| Macro-economic events | Bank stocks rise after the Fed pauses interest rate hikes. |
| Analysts recommendations | Goldman Sachs upgrades a semiconductor stock, sparking a 7% rally. |
| Social media hype | AMC jumps 20% intraday after gaining traction on WallStreetBets. |
| New product launches | Tesla gains 6% after unveiling a next-generation EV model. |
| Unusual volume | A mid-cap stock sees 15x its normal volume, driving day trader attention. |
| Legal/regulatory news | Cannabis stocks rally 15% after favorable legislation is passed. |
Catalysts are the “why” behind a stock’s movement—they can explain price action, shape market sentiment, and attract trading volume.
Such catalysts often fuel volatility and can keep stocks active throughout the trading day—or even sustain momentum over multiple sessions.
Filtering Top Gainers and Losers
While price volatility is the lifeblood of day trading, liquidity is its backbone.
Not every top mover will have enough liquidity to support seamless trading. Without sufficient liquidity, entering or exiting a position at the right price is hard.
Tools like ProRealTime’s top movers report allow you to filter stocks based on percentage change, volume, and other critical metrics, simplifying your pre-market scanning.
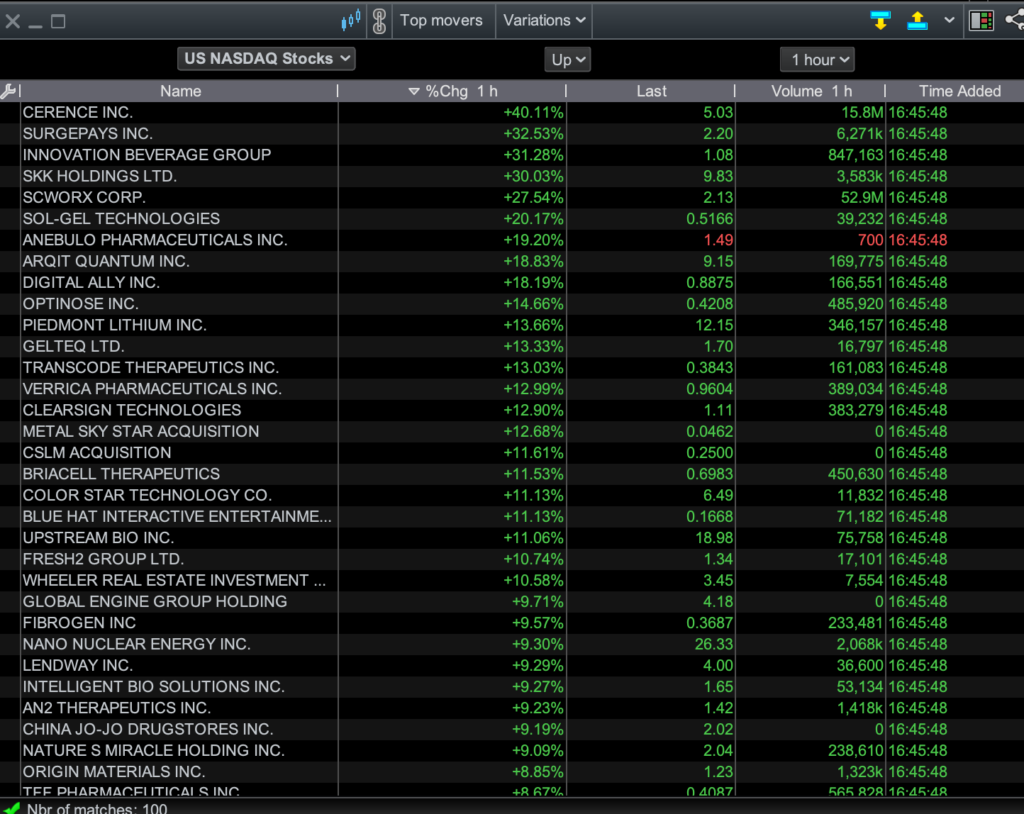
Top gainers. Stocks showing sharp pre-market price increases often attract buyers early and may sustain upward momentum after the open.
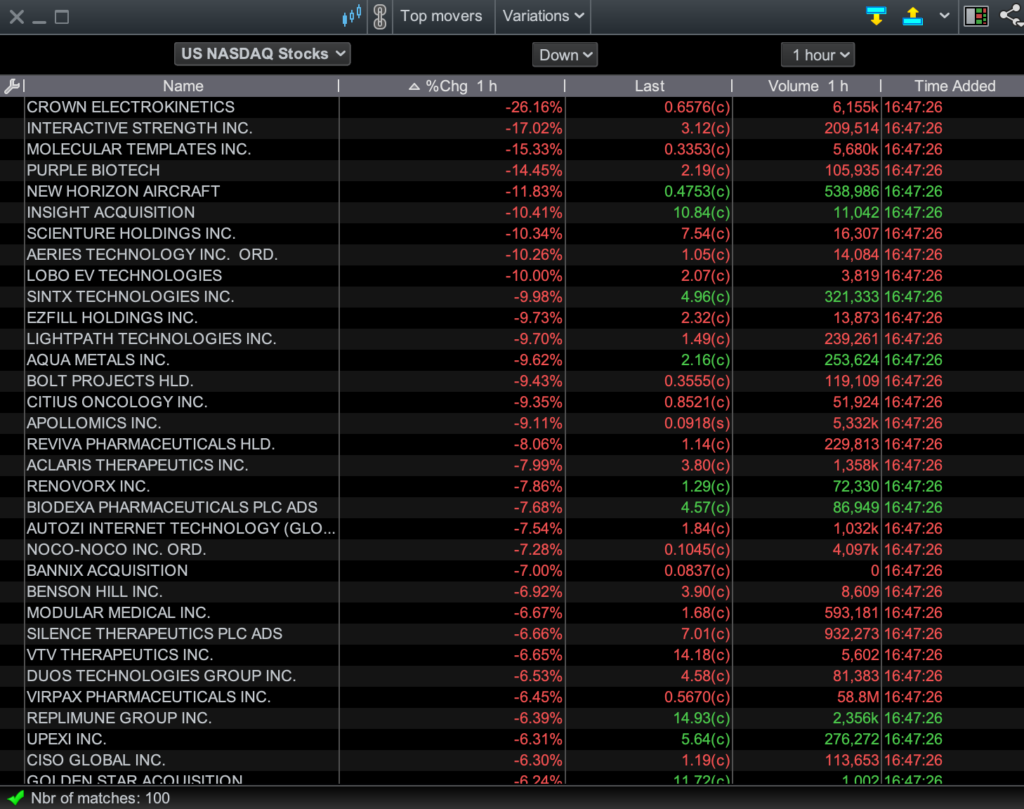
Top losers. Stocks experiencing significant pre-market drops, typically due to bad news or weak earnings. While riskier, they can offer opportunities for short trades or intraday reversals.
What About Unexplained Price Moves?
Some stocks with significant price movement and high volume lack an obvious catalyst like news or earnings. While these “unexplained” moves can sometimes present trading opportunities, they often come with added uncertainty.
These movements may result from speculative activity, technical triggers, or even anticipation of news that hasn’t been publicly disclosed.
When paired with strong technical patterns, such stocks can signal potential breakouts, but the absence of a clear catalyst increases the risk that momentum may fade unexpectedly.
The takeaway? Approach unexplained price moves with caution. Use technical and volume trends as part of your validation process, and if you include these stocks in your day trading watchlist, account for their higher unpredictability.
Stocks priced between $5 and $20 are a popular choice for many day traders. Why? They often deliver impressive percentage gains—like a $10 stock surging $4 for a 40% return—all without requiring the large capital investment of higher-priced stocks.
But there’s a tradeoff: these stocks are also more volatile. Sharp price swings can amplify both profits and losses.
Step 2: Look for Abnormal volume
Unusual trading volume is often the first sign that a stock is about to make a significant move.
When a stock’s trading volume surges well beyond its typical levels—sometimes 3x, 5x, or more over a set period—it’s worth a closer look.
These spikes usually indicate heightened market interest, often triggered by breaking news, earnings reports, or other major catalysts.
You can use ProRealTime to sort stocks with abnormal volume.
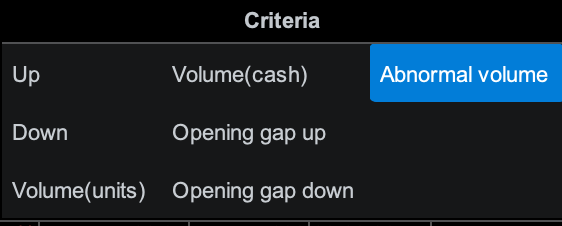
This saves you from digging through hundreds of tickers and helps filter in on the real outliers—the ones most likely to make it into a day trading stock list.

When analyzing volume data, these are the key numbers to pay attention to:
- Volume ratio (Vol ratio)
This compares today’s volume to the stock’s historical average (e.g., over the past five days). A high ratio signals unusual activity, potentially indicating volatility or a catalyst. - Total volume
While the ratio highlights activity spikes, raw volume numbers ensure there’s enough liquidity. Even with a high ratio, low overall volume can make trading difficult.
However, here’s the thing—abnormal volume alone isn’t enough. If a stock price isn’t moving, even with high volume, it’s probably not worth your time.
When analyzing volume, every day trader refines their own benchmarks to streamline decision-making over time. You can focus on stocks with a minimum of 20 million in absolute volume and at least 5x relative volume.
This strikes a balance between strong market interest and a level of liquidity that you may be comfortable with, ensuring smoother entries and exits in fast-moving trades.
These benchmarks are just an example — not a universal rule. What works for one trader may not work for another. Your ideal volume criteria will depend on your unique trading goals, style, and risk tolerance.
Experiment with different thresholds to find what aligns with your approach. The key is building a system that feels intuitive and delivers consistent results for you.
Abnormal volume doesn’t guarantee liquidity. For stocks with very low initial average volume, even a large multiplier might not create enough activity for smooth entries and exits. Always cross-check the absolute volume to confirm the stock is liquid enough to trade effectively.
Step 3: Identify Gappers
“Gappers” are stocks that open significantly higher or lower than their previous day’s close. These moves are often driven by fresh news or earnings and can lead to sustained momentum once the market opens.
ProRealTime’s filtering options make it easy to spot opportunities by sorting stocks based on gaps (both up and down).
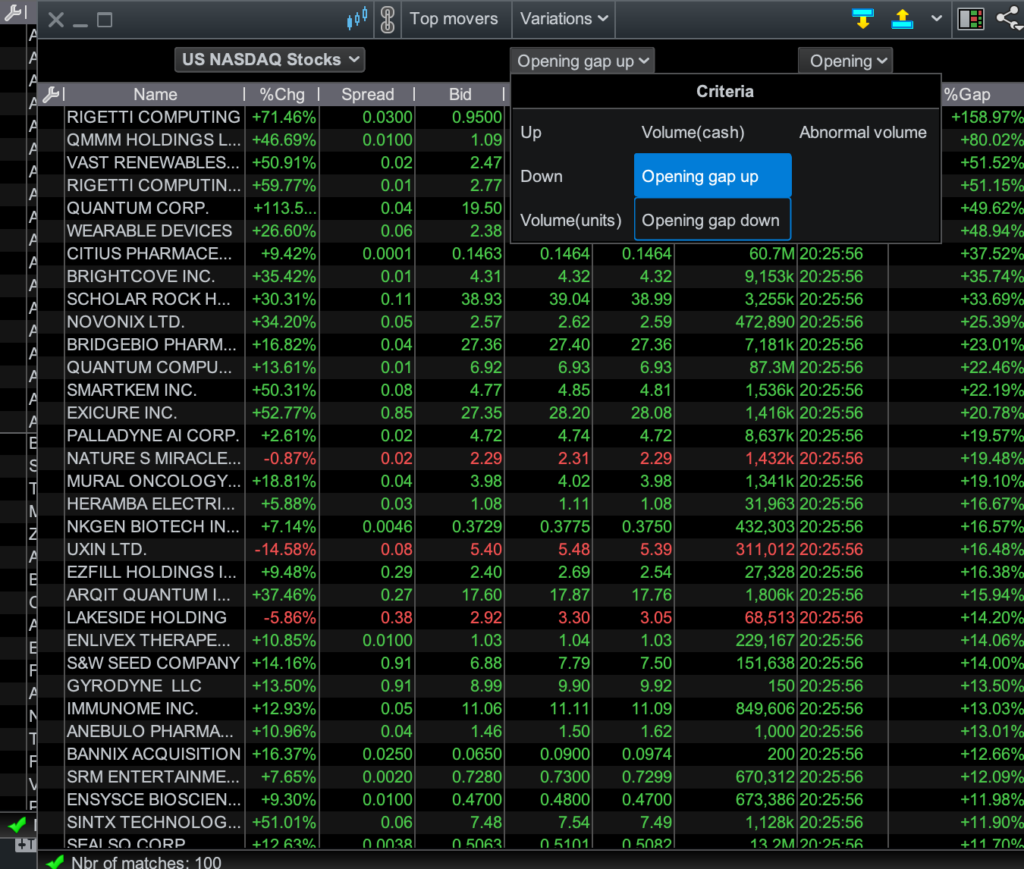
Here’s an example:

The % gap column indicates stocks with noteworthy opening price gaps, sorted by size.
Look for stocks with noticeable price gaps—whether up or down. Big gaps usually mean increased volatility and lots of trader attention.
Understanding how to leverage gap trading strategies can help you take advantage of these opportunities.
Step 4: Refine Your Float and Market Cap Preferences
In day trading, float—the number of shares available for public trading—plays a critical role in how a stock behaves. Unlike outstanding shares, which include all shares issued by a company, float refers only to the shares actively traded in the market. This is a key distinction for day traders.
Why Float Matters
Stocks with a low float often experience sharper price movements. Why? A limited supply amplifies the effects when demand surges, creating the potential for explosive price movements.
While this volatility can lead to big opportunities, it also comes with significant risks like liquidity challenges and wider bid-ask spread.
Here’s the trade-off:
- Low-float stocks can offer wild price swings but are harder to trade efficiently.
- Higher-float stocks are typically more stable and easier to trade but may not deliver the same level of intraday volatility.
How to Find Stocks by Float
If you want to screen stocks by float, Finviz is one of the most user-friendly free tools available.
Here’s how you can use it:

- Set float parameters.
Filter stocks by float size (e.g., under 20 million for high volatility or over 50 million for more stability). - Input a specific ticker.
Quickly check the float of a stock you’re interested in trading. - Layer other filters.
Combine float with other criteria like market cap, relative volume, or sector to refine your watchlist further.
Example: Let’s say you want stocks with low float and high volatility. Set your float filter to “under 20 million” and use additional filters like high relative volume or a sector of interest.
Low Float and Bid-Ask Spread: A Real Example
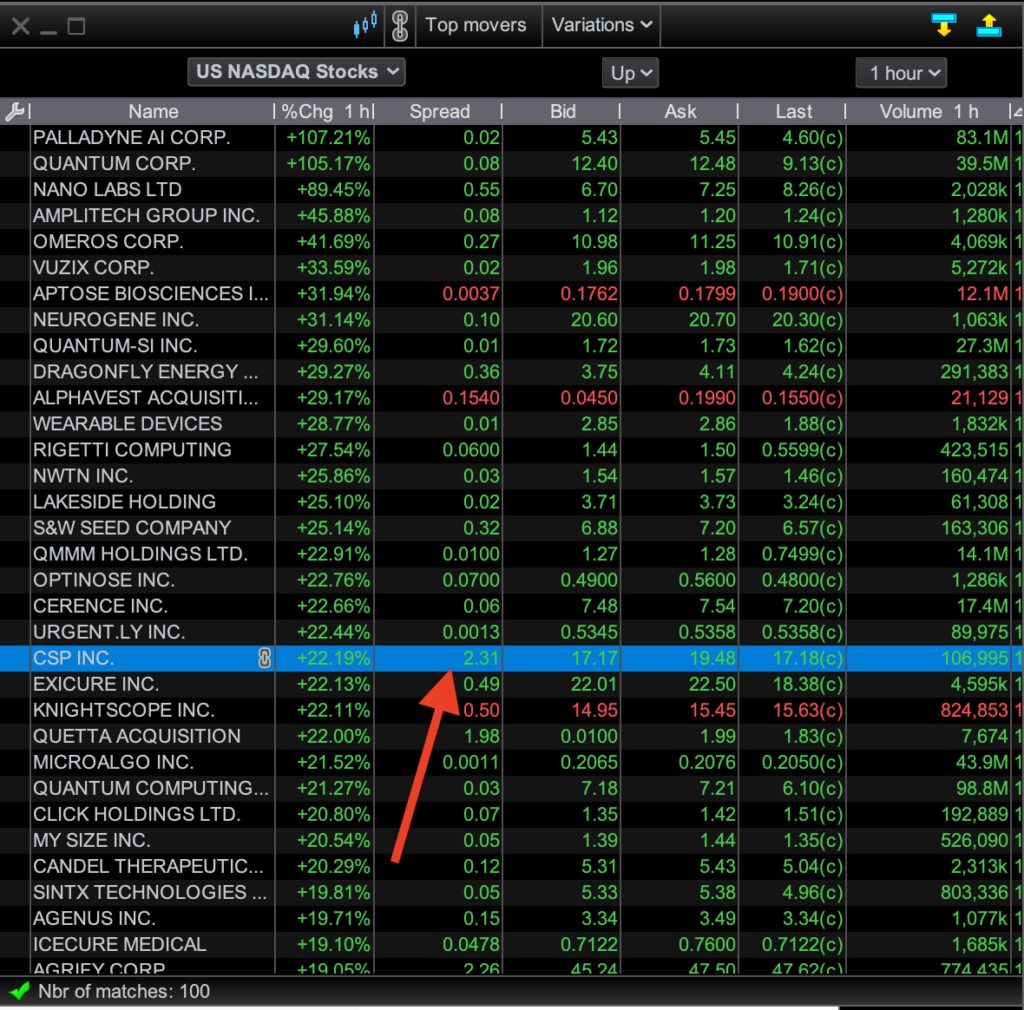
Take a look at the ProRealTime report above. CSP Inc, with a float of approximately 6.77 million (according to Finviz), had a bid-ask spread of $2.31 on that day (Bid: $17.17, Ask: $19.48). For a day trader, the stock needed to move at least $2.31 just to break even, making it a high-risk choice.
Low-float stocks often feature wider spreads and liquidity issues, which can complicate trading. These challenges include slippage, where the actual price of entry or exit differs from your intended price. For newer traders, this can lead to unexpected losses.
If you’re just starting out, prioritize higher-float stocks with narrower bid-ask spreads. They’re easier to trade efficiently and allow you to focus on refining your strategy. Once you’ve gained experience, you can explore low-float stocks—but only if you’re comfortable with their inherent risks.
To avoid slippage, some day traders use limit orders to specify the price that they want to buy or sell; the downside is, unlike market orders, there’s no guarantee the order will be executed, leaving the trader on the sidelines while the stock is potentially moving. Depending on the broker you use, different types of stock orders will be available to you.
Which Market Cap Should You Trade?
Float is just one piece of the puzzle. Market Capitalization—the total value of a company’s shares—offers another way to categorize stocks and assess their volatility and liquidity.
Here’s a quick breakdown:
- Small-cap stocks (under $2 billion): These are often high-risk, high-reward plays, with dramatic price swings but less liquidity.
- Mid-cap stocks ($2 billion–$10 billion): These balance volatility and liquidity, making them versatile for different strategies.
- Large-cap stocks (over $10 billion): These provide high liquidity and more predictable movements, perfect for traders looking for steadier setups.
Smaller-cap stocks often overlap with low-float stocks, amplifying both their potential and their risk. Mid- and large-cap stocks tend to strike a balance between movement and stability.
How I would Approach Float
Every trader’s preferences are different. My way may be to avoid trading stocks with a float below 20 million shares. For me, the unpredictability and liquidity challenges outweigh the potential gains.
For new day traders, I recommend avoiding lower-float stocks entirely until you’ve gained enough experience to manage their heightened risks effectively. Instead, focus on stocks with higher floats, as they tend to offer better liquidity and less erratic price movements.
Step 5: Refine Your Picks but Avoid Analysis Paralysis
Once you’ve built your watchlist using certain metrics — price movement, volume, catalysts, and float—it’s time to refine your selections with some advanced tools.
These indicators can help uncover opportunities that align more closely with your trading strategy, but remember: the goal is clarity, not overcomplication.
Beta
Beta measures a stock’s volatility compared to the overall market.
- A beta above 1 indicates higher volatility, ideal for traders seeking large swings.
- A beta below 1 suggests stability, suited for traders preferring steadier moves.
Example: A tech stock with a beta of 1.6 will experience sharper moves than a utility stock with a beta of 0.7.
Platforms like TradingView offer free lists of high-beta stocks. Use this resource to quickly spot volatile candidates. Many brokerages and financial sites like Yahoo Finance also display Beta in their stock summaries.
Average True Range (ATR)
The ATR is a valuable tool for day traders because it provides a snapshot of a stock’s recent volatility. By measuring the average range between a stock’s high and low prices (including gaps), ATR helps you gauge how much a stock typically moves within a given day.
Example: A stock with an ATR of $4 has shown higher volatility compared to one with an ATR of $2.
To streamline your search, ProRealTime’s ProScreener lets you filter stocks by ATR. For instance, you can target stocks with an ATR that fits your criteria.
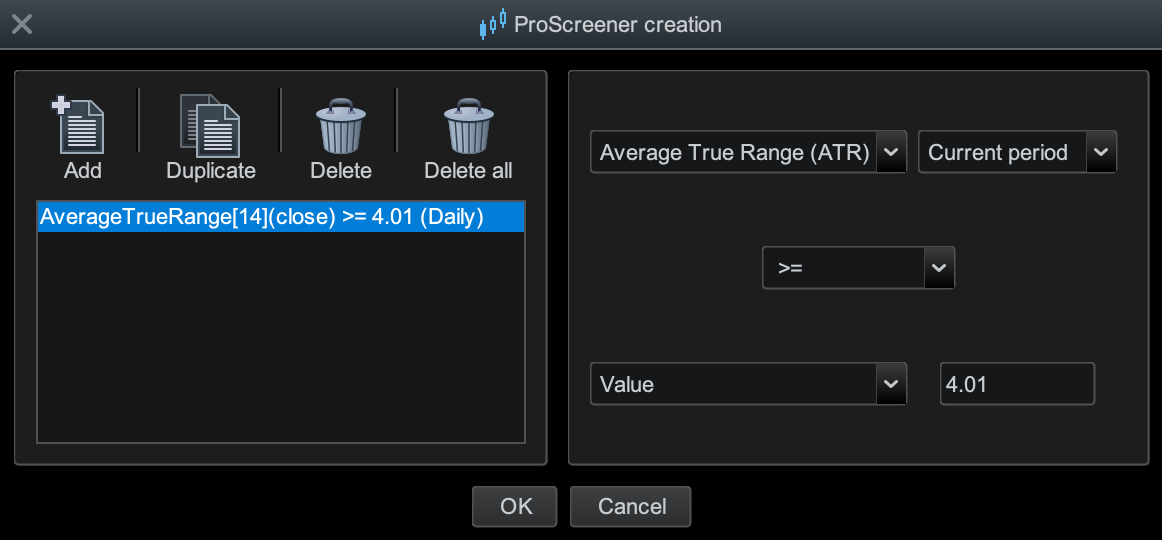
You can also display the ATR below your stock chart for instant insights, as shown here, helping you decide if a stock matches your strategy.

While ATR reflects past price volatility, keep in mind that it can be affected by one-time large moves, like a sudden gap. This means it’s more useful for understanding trends than for predicting exact future price movements.
To complement ATR, consider using Historical Volatility (HV), which calculates the standard deviation of a stock’s returns over a chosen timeframe (e.g., 20, 30, or 90 days).
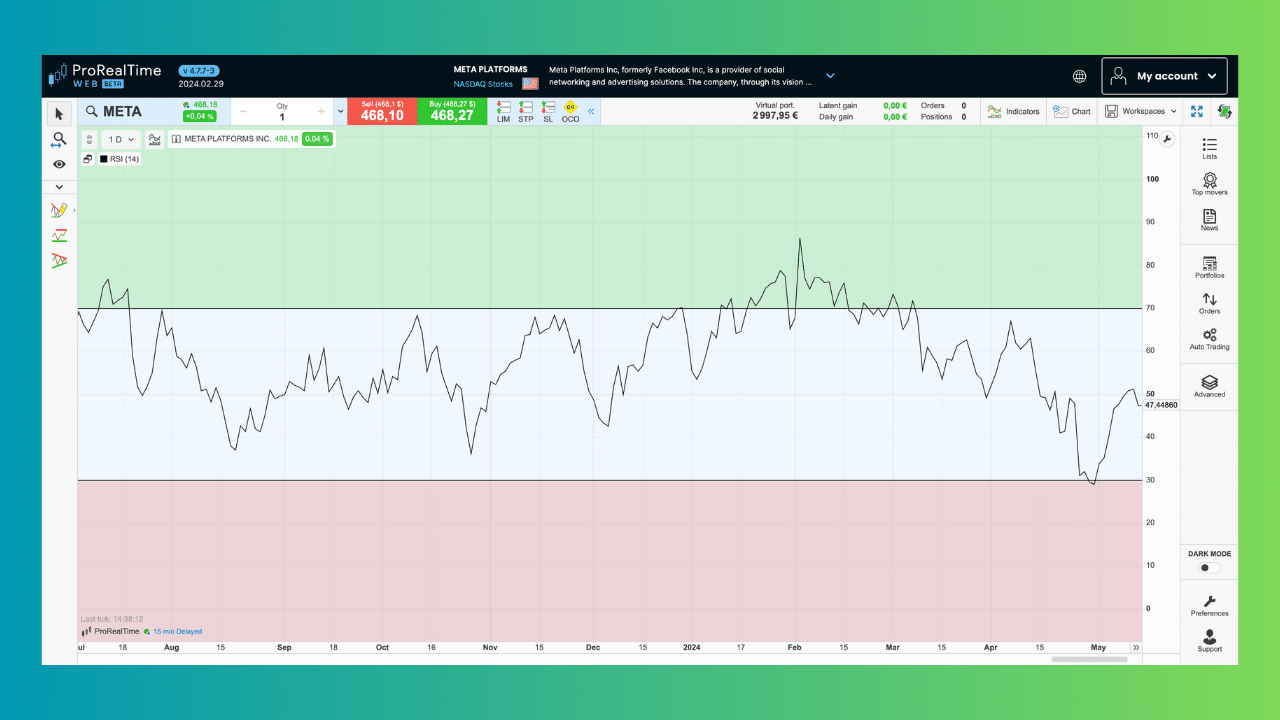
ATR is just one of many indicators available. ProRealTime offers filtering for technical metrics such as Relative Strength Index (RSI), simple moving averages (SMAs), MACD, and even custom parameters, giving you the flexibility to tailor your screeners. This versatility makes it a practical tool for refining your watchlist.
Keep in mind: The key isn’t using every available tool but selecting a few that work for you and integrating them into a consistent, repeatable system.
Final thoughts
Day trading isn’t about finding the perfect stock—it’s about building a repeatable process that aligns with your trading goals and risk tolerance.
Start simple. Focus on key metrics like price movement, volume, catalysts, and float to create a manageable watchlist. As you gain experience, you can incorporate advanced tools like Beta and ATR to refine your selections and adapt your strategy over time.
Avoid overloading your system. Too many metrics lead to analysis paralysis, making it harder to act decisively. Stick to a handful of indicators that resonate with your style, and focus on consistently testing and improving your approach.
If you’re just starting out, keep your watchlist small—1 to 3 high-potential stocks—and practice using a simulator. This allows you to refine your skills without taking unnecessary risks.
Remember: There’s no secret shortcut to success in day trading. Most day traders don’t turn a profit. Success isn’t just about picking the right stocks—it’s about how you trade them.
Approach every session with a plan, stay flexible, and treat every trade as a learning opportunity.

Cedric is a seasoned investment management strategist with over a decade of experience, currently working at TTUTC. He holds dual prestigious designations as a Chartered Market Technician (CMT) and Chartered Financial Analyst (CFA).
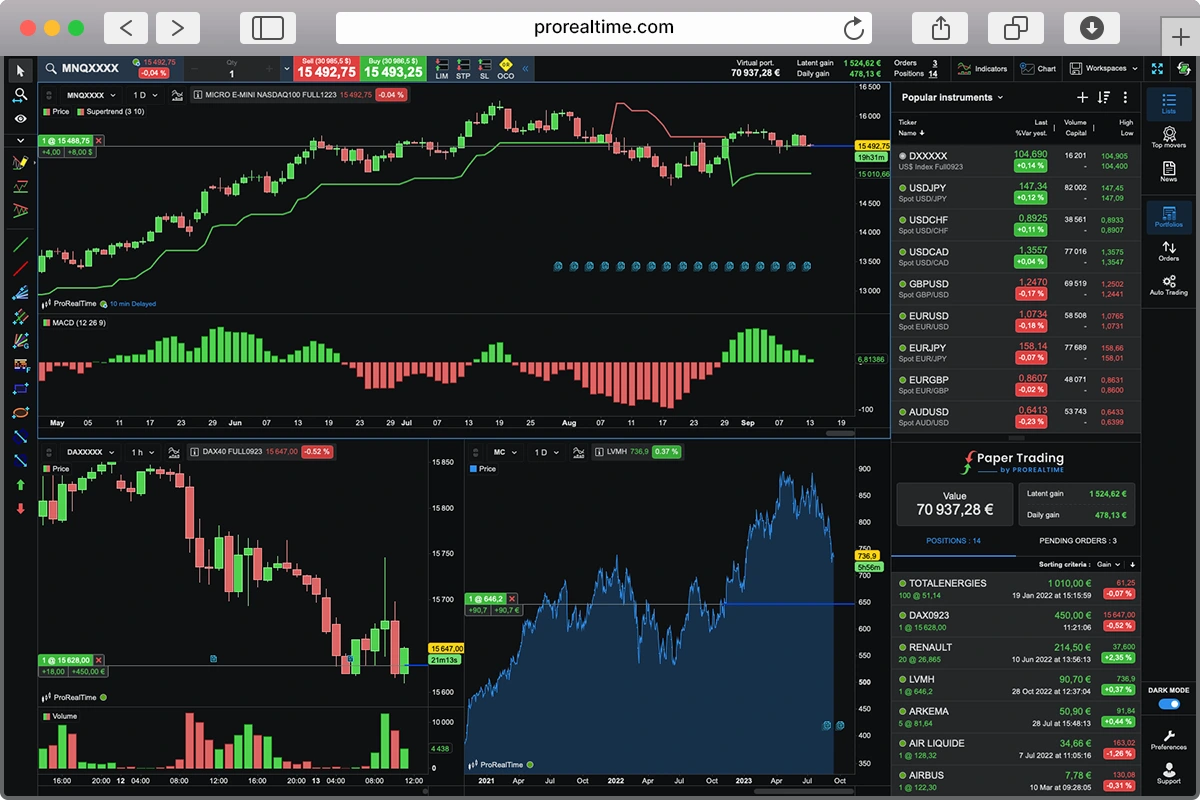
Enjoy free trading practice on
ProRealTime Paper Trading Simulator.


