Is TradingView Premium Worth It? Full Guide (Free vs Essential vs Plus vs Premium)


You’re staring at TradingView’s pricing page.
Four subscription tiers. Prices ranging from $12.95 to $199.95 per month. A long list of features that all start to blur together.
And one question: Which plan do you actually need?

TradingView lists features, “5 indicators per chart” versus “10 indicators per chart”, but they don’t tell you when those differences actually matter for your trading.
They don’t answer the real question:
When does upgrading improve your trading decisions, and when are you just paying for features you’ll never use?
In this article, we’ll dive into the strategic differences between each TradingView’s plans:
- Why most traders are overpaying for their TradingView subscription
- The one plan that offers the best value for 90% of retail traders
- Which Premium-only features actually save you time (and which are just marketing)
- The psychological pricing tricks TradingView uses to push you toward more expensive tiers
- A simple decision framework to match your trading style with the right subscription
Not just what you get, but when each upgrade makes financial sense, and when it may be wasted money.
Let’s start with the plan most people ignore: the free version.
What TradingView Gives You for Free (And Where It Breaks Down)
The TradingView free plan is surprisingly powerful.
You get professional charting tools. Access to global markets. 100+ technical indicators. Every drawing tool.
But here’s the problem:
You can only view one chart at a time.
Need to watch Bitcoin on 1-minute, 5-minute, and 15-minute timeframes simultaneously?
Not possible.
Want to monitor the daily chart for major support while tracking your 4-hour entry setup?
You’re clicking back and forth. Losing context. Missing critical moments.
Multi-timeframe analysis? That’s fundamental to most active trading approaches. The free plan blocks it.
The other limitations stack up fast:
- 3 indicators per chart (drop one if your strategy needs 4)
- 1 saved layout (rebuild your workspace every time you switch strategies)
- 1 price alert (manually monitor everything else)
- 5,000 historical bars (17 days on 5-minute charts, not enough for robust testing)
- No Bar Replay (can’t practice on historical data)
- Ads and upgrade pop-ups (sometimes at critical moments)
Not seeing multiple timeframes when your strategy depends on it? That’s an analytical blocker.
Needing 4 indicators when you can only use 3? You’re compromising your tested approach.
Can’t practice with Bar Replay? You’re skipping skill development.
The free plan works for position traders with simple setups. For more features at no cost, see our guide to free stock charts.
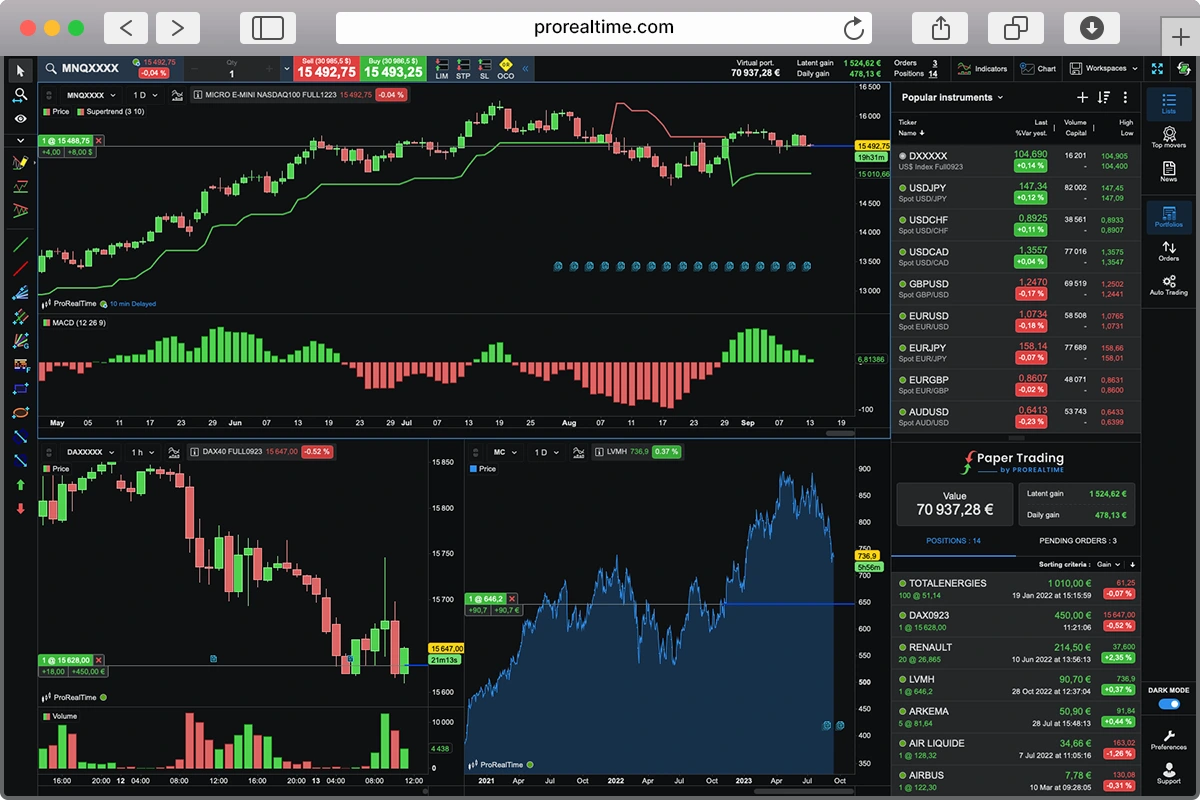
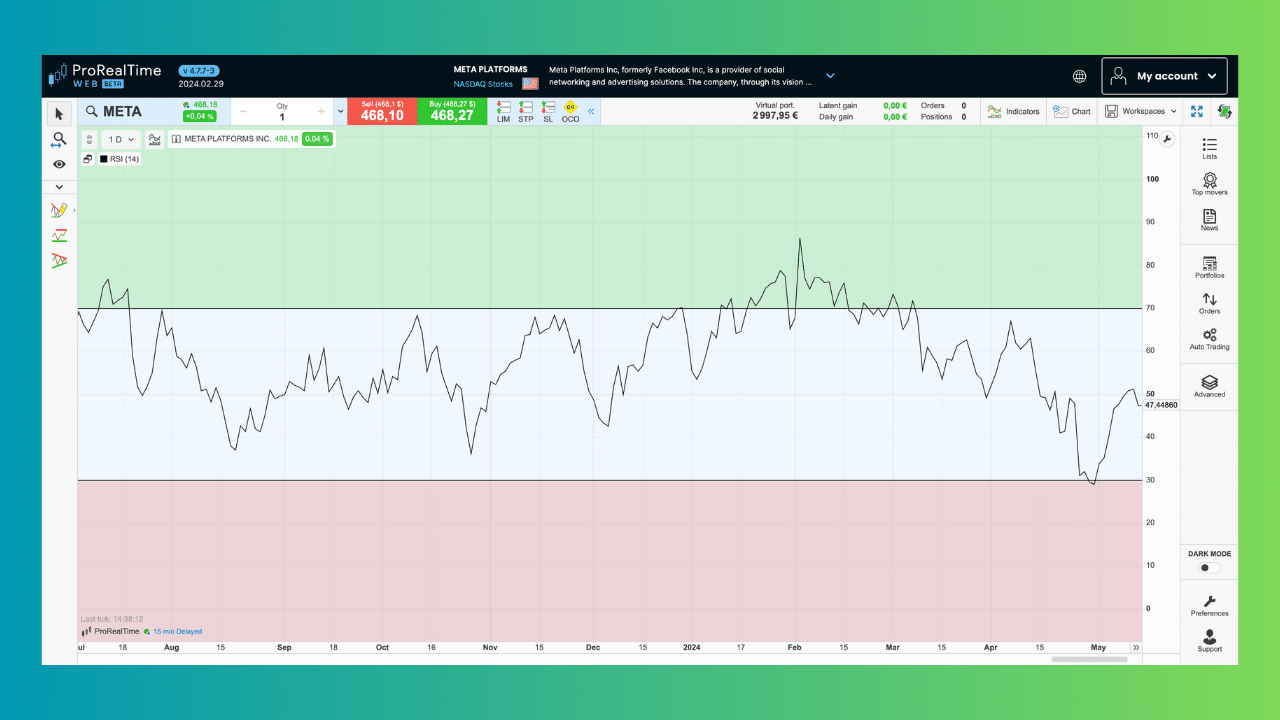
ProRealTime Web offers multiple chart layouts, more indicators, and multi-timeframe views completely free. If you’re hesitant about paying for TradingView, it’s worth comparing before committing. Also, we’ve listed the best alternatives to TradingView here.
TradingView Essential – $12.95/Month (The Sweet Spot Most Traders Miss)
Essential costs $12.95 per month when billed annually.
Here’s what changes from free, and what actually matters.
The 2-chart layout is the real upgrade.
You can now view two charts simultaneously in one tab. Watch any instrument on 1-minute while monitoring the 5-minute. Track your 4-hour entry setup while keeping the daily chart visible for context on the underlying market structure.
Still not perfect, you can’t view three timeframes at once… but sufficient for most confirmation strategies. If your edge depends on seeing how price behaves across two timeframes simultaneously and you barely look at the third chart, Essential removes that obstacle. If you only ever look at one timeframe, this feature doesn’t matter.
5 indicators per chart instead of 3

Your strategy needs two moving averages, RSI, MACD, and volume? That’s five indicators. Essential accommodates it. Free forced you to drop two.
But here’s the question: Does your tested approach actually require all five, or are you just adding indicators because you can?
Ad-free experience during analysis.
Ads appear on the free plan throughout your session. They’re not covering your charts, but they’re present in the interface. Some traders find them distracting during volatile periods. Others barely notice.
The ad-free interface costs $13/month. Whether that’s worth it depends on how much the ads genuinely interrupt your focus versus just annoying you aesthetically.
Volume Profile and institutional analysis tools.
Volume Profile shows where high-volume trading occurred at specific price levels. Where institutions accumulated or distributed positions. Where support and resistance might form based on actual transaction activity.
This doesn’t exist on free. Essential unlocks it. If you trade around institutional order flow or high-volume nodes, this changes your analytical capability. If you’ve never used Volume Profile, don’t assume you need it just because it sounds advanced.
Bar Replay for deliberate practice.
Step through historical price action bar-by-bar. Make entry and exit decisions as if trading live. Then see what actually happened.
This is skill development without capital risk. You can practice pattern recognition, test your timing, refine your decision-making process on 100+ historical examples before putting money on the line.
Free doesn’t offer this. Essential does.
20 price alerts instead of 1.
Track multiple setups across different markets. Get notified when any of 20 different price levels trigger.
If you monitor 5-10 potential trades simultaneously, this matters. If you focus on 1-2 setups at a time, you won’t use 20 alerts anyway.
5 saved chart layouts instead of 1.
Save different workspace configurations for different strategies or markets. Your day trading setup. Your swing trading setup. Your scalping layout versus your stocks layout.
Switch between them instantly without manual reconfiguration. If you trade multiple approaches with different indicator combinations, this saves significant daily time. If you use one consistent setup, you’ll never touch the other four saved layouts.
Here’s what determines if Essential makes sense:
Are you hitting the 1-chart-per-tab limit and losing context when switching between timeframes?
Does your tested strategy need 4-5 indicators and free’s 3-indicator limit forces compromises? That’s a legitimate reason to upgrade.
Do you want to practice setups on historical data before risking capital? Bar Replay enables that.
Are the ads just annoying, or do they genuinely disrupt your focus during critical decision moments? One is convenience, the other is execution quality.
Essential works for multi-timeframe traders needing 2-chart visibility, strategies requiring 4-5 indicators, and anyone incorporating Volume Profile analysis. It’s the best value-per-dollar in TradingView’s lineup—you eliminate major free plan restrictions without paying for Premium features you probably won’t use.
If you join TradingView through any of the links in this article, you’ll get an instant $15 credit discount—automatically applied to whichever plan you pick.
Keep in mind that TradingView often runs special discounts during Black Friday, making it a great time to upgrade your current yearly plan or start a new one.
TradingView Plus – $28.29/Month (The Awkward Middle Child)
Plus costs $28.29 per month when billed annually.
Here’s what changes from Essential—and whether it actually matters.
4 charts per tab instead of 2.
You can now view four charts simultaneously. Monitor four different timeframes of one instrument. Watch four different markets side-by-side. Compare your position against three related assets or indices.
This enables more comprehensive multi-timeframe analysis than Essential’s 2-chart limit. You can see 1-minute, 5-minute, 15-minute, and 1-hour charts all at once. Or track your main position plus three correlated markets for context.
But here’s the reality: Most retail traders don’t need four simultaneous charts. If your strategy requires confirmation across two timeframes, Essential’s 2-chart layout handles it. The jump from 2 to 4 charts sounds significant but often goes unused. Ask yourself: When do you genuinely need four charts visible at once versus just wanting more screen space?
10 indicators per chart instead of 5.
Your strategy can now use ten technical indicators simultaneously. Two moving averages, RSI, MACD, Bollinger Bands, Stochastic, ATR, volume, and two custom indicators, all visible at once.
The question: Does your tested approach actually require 10 indicators, or are you stacking them because the platform allows it? Most profitable strategies use 3-5 indicators maximum. If you need 6-8 indicators because your backtesting proved each component adds statistical edge, Plus accommodates that. If you’re adding indicators because more data feels safer, you’re paying for analytical clutter.
100 price alerts instead of 20.
Track 100 different price levels across multiple markets. Get notifications when any of them trigger.
Essential’s 20 alerts handle most active traders monitoring 10-15 setups simultaneously. Who genuinely needs 100 alerts? Traders running systematic strategies across 50+ instruments. Professional scanners watching entire sectors for breakout conditions. If you’re a retail trader focusing on 5-10 high-probability setups, you won’t use 100 alerts. You’ll use 15 and ignore the other 85.
Custom timeframes and intraday exotic charts.
Create non-standard intervals like 2-hour charts, 3-day charts, or 90-minute charts. Use intraday Renko, Kagi, Line Break, and Point & Figure charts.
Custom timeframes matter for specific use cases, analyzing particular trading sessions, matching your charts to unique market rhythms, or testing strategies on intervals that aren’t standard. Most traders never touch this feature. Daily, 4-hour, 1-hour, 15-minute charts cover 95% of analytical needs. Unless you have a specific reason for custom intervals, this capability sits unused.
Intraday exotic chart types (Renko, Kagi) filter out time-based noise and focus purely on price movement. Useful for certain price action strategies. Irrelevant for most technical approaches based on candlestick patterns and indicator signals.
10K historical bars instead of Essential’s 10K.
Essential already gives you 10K bars. Plus also gives you 10K bars.
No difference here. Both plans provide the same historical data depth. On 5-minute charts, that’s about 35 days of data. On daily charts, roughly 40 years.
100 technical alerts instead of 20.
Technical alerts trigger when indicator conditions are met—RSI crosses above 70, MACD crosses its signal line, price breaks above a moving average.
Essential’s 20 technical alerts cover most strategies with 5-10 monitored setups. Plus gives you 100. Unless you’re running complex multi-indicator systems across dozens of instruments simultaneously, you won’t need 80 extra technical alerts.
Here’s the problem with Plus:
It’s a capacity increase, not a capability unlock.
Essential to Plus gives you more of what you already have, more charts, more indicators, more alerts. But no new analytical tools. No unique features that don’t exist at lower tiers.
Premium unlocks Auto Chart Patterns, second-based intervals, custom formulas, tools that don’t exist on Plus. Essential unlocks Volume Profile and Bar Replay—tools that don’t exist on free.
Plus just gives you bigger numbers. More slots. Higher limits.
Who actually needs Plus:
Traders genuinely requiring 3-4 chart views simultaneously for their analytical process. Strategies that tested profitably with 6-8 indicators and removing any degrades performance. Systematic traders monitoring 30-50 setups across multiple markets who need 50+ alerts.
That’s a small subset of retail traders.
Who should skip Plus:
If your strategy works with 2 charts and 5 indicators on Essential, Plus adds nothing meaningful. You’re paying $15/month extra for capacity you won’t use.
If you need unique tools like Auto Chart Patterns or second-based precision, jump to Premium instead. Don’t stop at Plus for features that don’t exist there anyway.
If you’re on free and thinking about upgrading, evaluate Essential first. Most traders who think they need Plus actually just need Essential’s 2-chart layout and 5-indicator capacity.
The honest assessment:
Plus is TradingView’s “awkward middle child.”
It’s better than Essential but not different enough to justify the $15/month increase for most traders. It’s cheaper than Premium but lacks the unique tools that make Premium compelling for active traders.
Unless you specifically need 4 simultaneous charts or 6-8 indicators because your tested strategy requires them, Plus probably isn’t your optimal tier. Either Essential handles your needs, or Premium’s advanced features justify the jump to $56/month.
Plus exists mostly for traders who outgrew Essential but don’t want Premium’s price. That’s valid. But carefully evaluate whether you’re buying capacity you’ll actually use versus capacity that just feels more professional.
TradingView Premium – $56.49/Month (Where Unique Capabilities Actually Begin)
Premium costs $56.49 per month when billed annually.
Here’s what changes from Plus, and this is where things get different.
8 charts per tab changes your workspace capacity.
You can now view eight charts simultaneously. Monitor eight timeframes of one instrument. Track eight different markets.
Compare your positions across multiple assets with comprehensive context. But let’s be realistic: eight simultaneous charts is excessive for most retail traders. Your eyes can only focus on so much information at once. The jump from 4 to 8 charts sounds impressive but typically becomes visual clutter rather than analytical clarity.
If you’re managing a large portfolio and need to see 8+ positions simultaneously, this matters. If you’re trading 1-3 setups with multi-timeframe confirmation, you’ll never use all eight chart slots. The value here is narrow for institutional traders, portfolio managers, or multi-strategy systematic traders. Most individuals won’t use this capacity.
25 indicators per chart is capacity overkill.
Your strategy can now layer 25 technical indicators on a single chart. Stop and think about that. If your analytical approach genuinely requires 25 simultaneous indicators, your strategy is almost certainly overfit and too complex to execute consistently. Most profitable traders use 3-5 indicators maximum. Some use 6-8 for specific systematic approaches. Who needs 25? Essentially no one. This is capacity for the sake of capacity. Don’t confuse having access to 25 indicator slots with needing them. The expanded numbers here don’t solve real analytical problems for most traders.
20K historical bars enables better backtesting.
Premium doubles your historical data access. On 5-minute charts, you get approximately 70 days of data instead of 35. On daily charts, roughly 80 years instead of 40. This matters for one specific use case: backtesting intraday strategies with statistical significance. If you’re developing and validating a 5-minute trading system, 35 days isn’t enough sample size. 70 days provides more robust testing across different market conditions. For live trading on already-validated strategies, the extra historical bars don’t change anything. You’re analyzing recent price action, not looking back six months on a 5-minute chart. This is a genuine capability upgrade if you’re in the strategy development phase.
TradingView Ultimate – $199.95/Month (Not For You)
Ultimate costs $199.95 per month annually. That’s $2,399 per year for a charting platform. You get 16 charts per tab, 50 indicators per chart, 1,000 alerts, 40K historical bars, and priority support. This is built for institutional traders, hedge funds, and professional operations managing dozens of positions simultaneously. If you’re an individual retail trader managing your own capital, Ultimate is financial waste. Even highly successful retail traders rarely exceed Premium’s capabilities. Unless you’re regularly maxing out Premium’s limits and can specifically articulate why you need 50 indicators per chart, skip Ultimate entirely.
The Bottom Line: Which Plan Actually Makes Sense?
Start with free and use it until you hit specific analytical obstacles. Not until you feel ready to upgrade or assume you need premium features. Most beginners waste money on subscriptions before understanding their actual needs. The free plan works well for single-timeframe traders with simple setups. Stay there until it genuinely blocks your strategy execution.
Upgrade to Essential ($12.95/month) when you need multi-timeframe analysis with 2 chart views, when your strategy requires 4-5 indicators, when you want Volume Profile for institutional analysis, when Bar Replay would help you practice without capital risk, or when ads genuinely disrupt your focus during volatile periods. Essential is the best value in TradingView’s lineup. It removes major free plan restrictions without paying for features you won’t use. Most retail traders never need more than Essential provides.
Skip Plus ($28.29/month) unless you specifically need 4 simultaneous charts, 6-8 indicators for a tested strategy, or 50+ alerts for systematic scanning across many instruments. Plus increases capacity without adding unique capabilities. Most traders either find Essential sufficient or discover that Premium’s unique tools justify the larger price jump. Plus exists for a narrow use case that doesn’t fit most retail approaches.
Choose Premium ($56.49/month) only when you need second-based charts for scalping precision, Auto Chart Patterns for faster multi-instrument scanning, 70+ days of 5-minute data for robust intraday backtesting, or custom formula charts for pairs and ratio trading. Premium unlocks tools that don’t exist on lower tiers, but only specific trading approaches actually need them. Swing traders and position traders working on 15-minute or higher timeframes rarely benefit from Premium’s unique features.
Here’s the reality most traders ignore: Your subscription tier has zero correlation with profitability. A disciplined trader with a proven edge on the free plan will outperform an undisciplined trader with Ultimate every single time.
Premium tools don’t create strategy. They don’t fix risk management problems. They don’t improve discipline. They provide infrastructure. If you’re not consistently profitable on your current tier, upgrading won’t change that. You’ll just have better charting tools while losing money.
Upgrade when you hit genuine obstacles that prevent executing your tested strategy. Not when you’re frustrated, bored, or assume premium features make you look more professional. Most traders need Essential. Some need Premium. Almost no one needs Ultimate. Choose the tier that removes real obstacles, not the one with the most features.

Maxime holds two master’s degrees from the SKEMA Business School and FFBC. As founder and editor-in-chief of NewTrading.fr, he writes daily about financial trading.


