Best Free Stock Charts: 5 Platforms Compared (2026)


Tired of hitting paywalls just to look at a stock chart?
Most charting platforms lock basic features behind subscriptions when you can get the same thing for free. I tested five free stock chart platforms over the past few weeks, scoring each on three things:
- How easy is the platform to navigate?
- Are the indicators powerful enough for serious analysis?
- What do you actually get for free versus what requires an upgrade?
The results are below, ranked from best to worst.


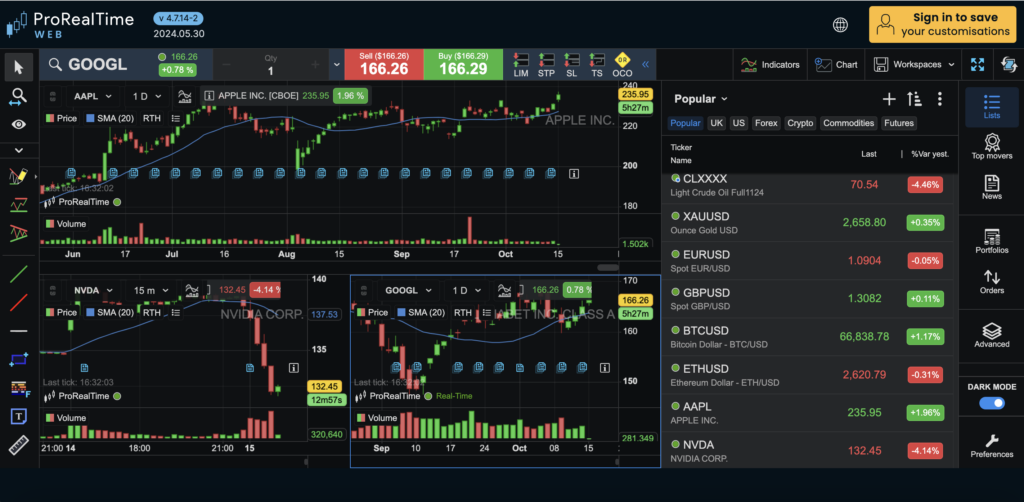
#1 – ProRealTime Web
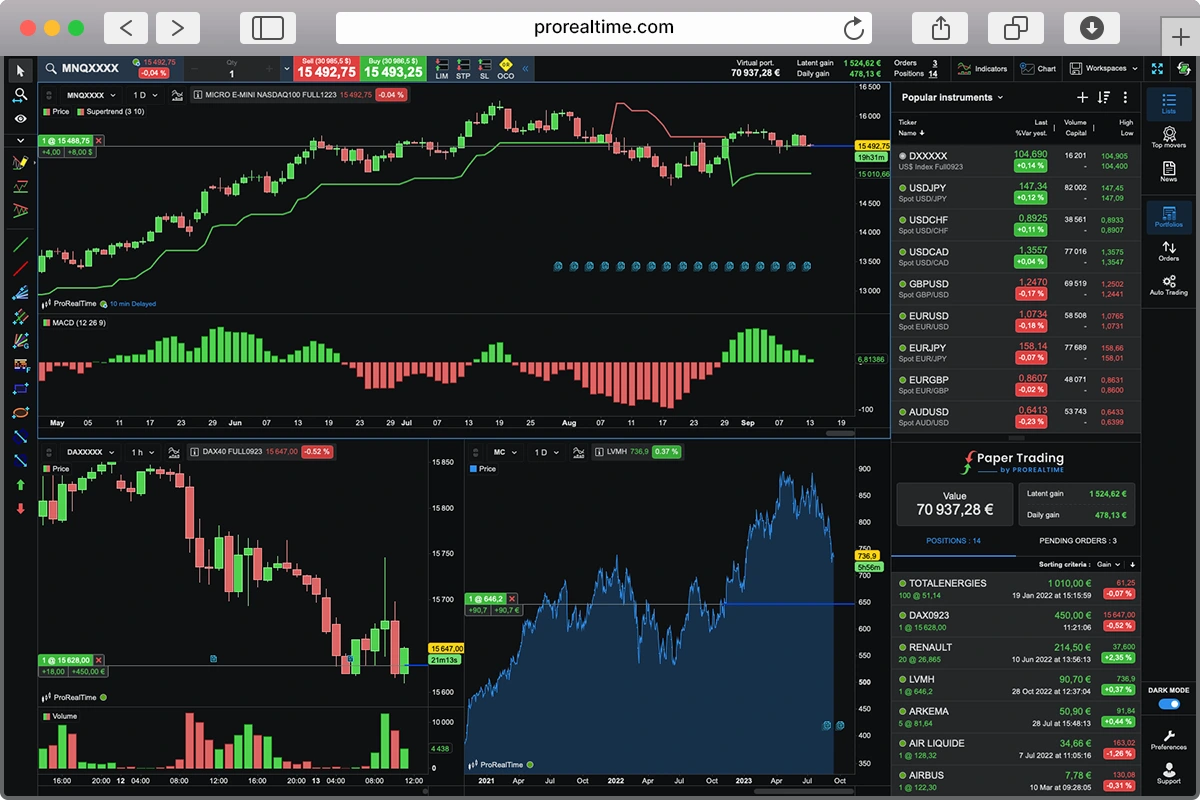
ProRealTime Web offers a comprehensive stock charting experience with no limitations on technical indicators or multi-chart layouts. Designed for traders seeking stock chart analysis and free customization without constant upgrade prompts or restrictions disrupting their experience, it stands out as a top choice for technical analysis—completely free.
About: Founded in 2001, ProRealTime is a French charting software company with over 1 million users worldwide. The platform provides access to price quotes for more than 500,000 financial instruments and is known for its advanced technical analysis tools. It’s a top choice for active traders seeking a 100% free professional-grade, web-based solution that works across multiple devices.
User Experience
ProRealTime’s interface is distraction-free—no ads, no upgrade prompts—just pure charting. You can jump straight into charts without signing up, and it’s highly customizable. Users can create multiple layouts, workspaces, and watchlists, while seamlessly adding charts side by side.
The dashboard is simple and intuitive. Drawing tools like trendlines and Fibonacci retracements are easily accessible, and applying technical indicators or switching timeframes is a breeze.
The right-hand panel keeps key market data within reach, ensuring the interface stays responsive and clutter-free even with multiple charts and indicators.
Charting & Technical Analysis Tools
ProRealTime provides an extensive suite of charting and technical analysis tools. You can seamlessly overlay multiple indicators like RSI, MACD, and moving averages while using intuitive drawing tools to map out trendlines, support, and resistance levels. Despite the depth of features, the platform remains highly responsive, ensuring a smooth experience.
Plus, the access to a vast range of financial instruments and historical data—without extra cost—is a major advantage.
Free Features
ProRealTime’s free plan outshines most competitors by offering key features like unlimited technical indicators, multi-timeframe support, and multiple chart layouts—all without paywalls.
Traders can also set up paper trading environments to test strategies risk-free. While real-time data and backtesting require a premium plan, the upcoming alert features on the free plan will make it even more valuable for market monitoring.
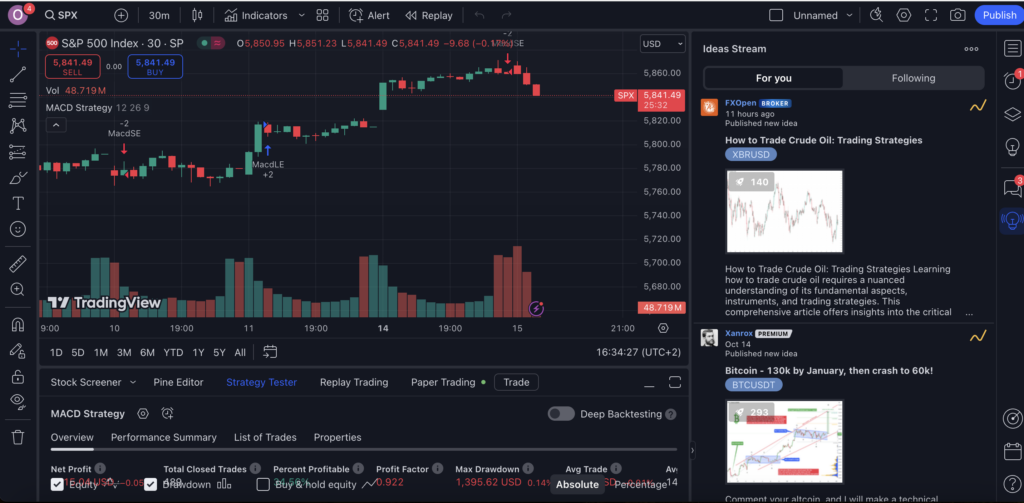
#2 – TradingView
TradingView’s free version includes solid charting tools, community features, and a modern UX. However, serious users may need to upgrade sooner than expected to access features available for free elsewhere, like multi-chart layouts and extra indicators.
About: Founded in 2011, TradingView has quickly become one of the most popular charting platforms, with over 100 million users worldwide. Headquartered in New York and with an office in London, TradingView stands out for its powerful charting tools and its social community.
User Experience
TradingView’s interface combines powerful charting tools with community-driven content. Users can access a wide range of technical indicators and drawing tools, while also exploring strategies shared by other traders. This collaborative environment fosters idea exchange but may lead to FOMO, potentially distracting users from their own strategies.
The platform’s free version offers core functionality, including customizable charts and basic analysis tools. However, frequent upgrade prompts can interrupt the user experience. While premium tiers provide enhanced features and remove these interruptions, the abundance of options may initially overwhelm new users.
Charting Tools & Technical Analysis
TradingView’s free version offers multiple chart types, including candlestick, bar, and Heikin Ashi, making it suitable for nearly any trading strategy. With over 100+ smart drawing tools—such as trendlines and Fibonacci retracements—it’s easy to create detailed analyses and visualize market trends effectively.
TradingView also stands out for its extensive library of indicators and community-created tools, making it hard to find something that isn’t covered by this platform. Whether you’re a beginner or an experienced trader, TradingView provides everything you need for technical analysis in one place.
Free Features
Free users face constraints: a single chart layout per tab and a maximum of two indicators per chart. This can hinder complex analysis, especially for those accustomed to multi-layered or multi-timeframe setups. The platform’s persistent upgrade reminders may test the patience of free-tier users.
That said, TradingView’s newsfeed and economic calendar are big wins. These tools, along with charts and analysis, are accessible through a smooth cross-platform experience—web, desktop, and a well-designed mobile app.
#3 – Yahoo Finance
Perfect for casual investors who need reliable free stock charts and price quotes without paying anything. While the free version includes ads, Yahoo Finance offers a no-fuss, effective solution for tracking assets and staying updated on financial data.
About: Founded in 1996, Yahoo Finance has become one of the most popular platforms for financial news, market data, and basic charting tools. It gives users access to real-time stock quotes, financial news, and a variety of charting options for stocks, cryptocurrencies, and commodities.
User Experience
Yahoo Finance offers a simple, intuitive interface that allows users to easily switch between financial data, news, and charting tools. However, while the tools are available, they are not as easy to use or customizable as platforms that focus heavily on charting. I found myself spending quite some time looking for basic features, which makes the overall experience less seamless compared to charting-focused platforms. Despite these limitations, the mobile app is highly functional, making it convenient to monitor markets on the go.
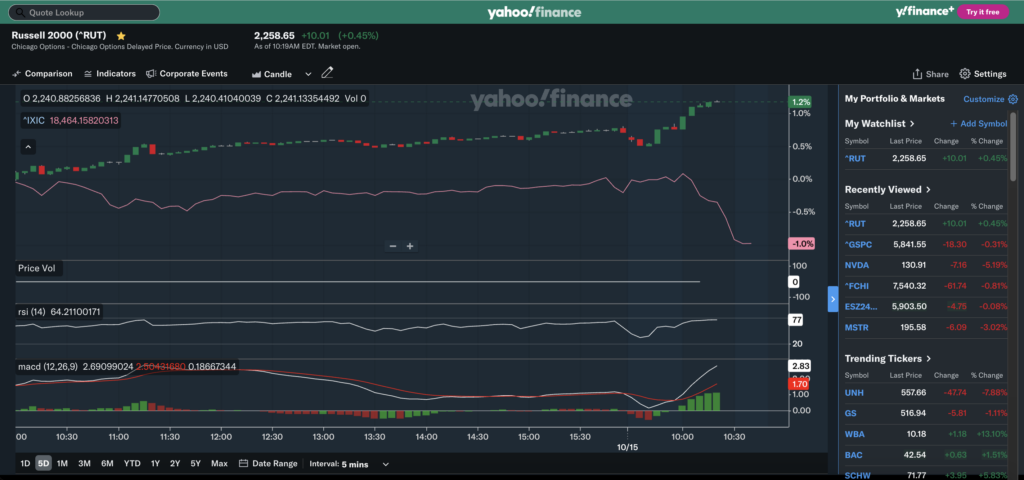
Charting & Technical Analysis Tools
Yahoo Finance gives you the basics, with unlimited access to indicators like MACD, RSI, and Fibonacci retracements. It also includes drawing tools that allow you to mark up your charts as needed. The charts are surprisingly good for a free platform, letting you compare multiple assets on the same chart—great for spotting correlations or keeping an eye on performance trends.
Feature Accessibility for Free Users
Yahoo Finance’s free plan stands out for providing a solid range of functionality for traders focused on basic charting and market monitoring. While more advanced features require Yahoo Finance Plus, the free version still delivers plenty of tools for those who need straightforward analysis without the bells and whistles.
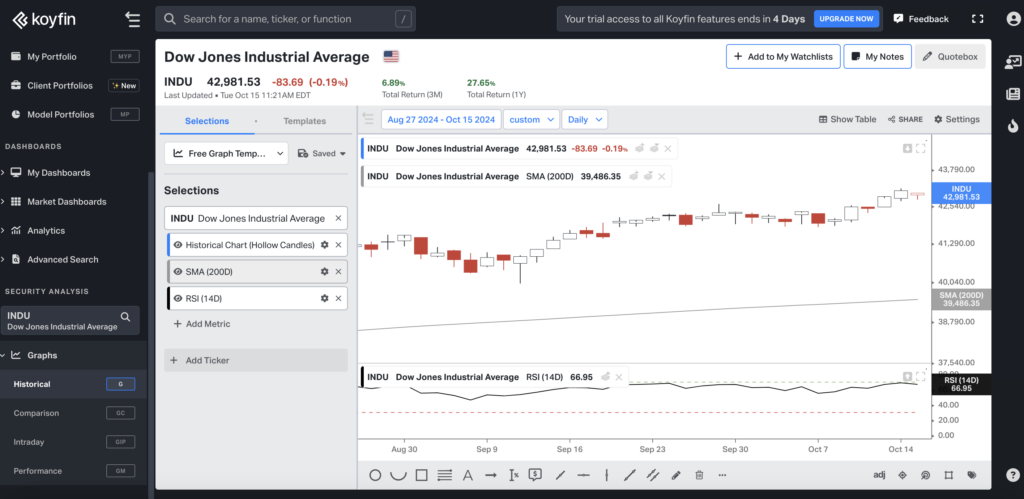
#4 – Koyfin
Koyfin is a versatile platform that combines financial data visualization with basic charting tools, making it ideal for traders and investors who value both macro trends and company-specific analysis. It’s perfect for those seeking easy access to fundamental insights paired with basic technical analysis. While Koyfin’s free plan provides useful tools, some advanced features, like intraday charts, require an upgrade.
Founded in 2018, Koyfin has quickly grown into a popular platform for traders and investors who need a mix of financial data and charting tools. It stands out for its ability to provide both macro-level insights and company-specific analysis, making it especially useful for users who prioritize fundamental data alongside technical analysis. While free users get access to basic charting tools and several chart types, features like intraday data and more advanced visualizations are only available on paid plans.
User Experience
Koyfin’s interface is sleek, modern, and intuitive, offering users a clean experience. The platform allows for smooth transitions between charts, data visualizations, and financial dashboards, creating a comprehensive tool for tracking both financial metrics and technical analysis.
Charting Tools & Technical Analysis
Koyfin offers a combination of financial data tools and basic charting features, making it ideal for traders who need both technical and fundamental analysis. The platform includes historical, intraday, and performance graphs, and users can customize these charts with overlays like revenue and profit data.
Feature Accessibility for Free Users
The free plan includes basic financial data, charting, and a few indicators, but has limitations. Free users are restricted in the number of watchlists, chart templates, and dashboards they can use. More advanced features like custom templates, intraday data, and enhanced visualizations require an upgrade to a paid plan. While the free plan is sufficient for general analysis, advanced users will need to consider the premium version.
#5 – StockCharts
StockCharts.com is a user-friendly platform with solid technical analysis tools and educational resources. While the free version limits indicators and lacks advanced features, it remains a good choice for long-term investors and casual traders seeking straightforward charting without unnecessary complexity.
About: Founded in 1999, StockCharts.com has earned a reputation as a reliable and user-friendly platform, especially for traders and long-term investors alike. With straightforward navigation, helpful educational tools, and an active YouTube channel, StockCharts makes learning and trading accessible for all experience levels.
User Experience
The old-school design of this charting website might be a turn-off for some, but once you get used to it, you’ll find it highly customizable, reliable, and easy to navigate. Free users will encounter ads, which can be a bit distracting. The inability to save workspaces also limits flexibility, but for those looking for a straightforward, free charting solution, StockCharts.com remains a solid choice.

Charting Tools & Technical Analysis
StockCharts provides the essential tools for technical analysis, including candlestick, line, and bar charts. While free users are limited to three indicators per chart, the platform offers enough features for basic setups and long-term analysis. The drawing tools and clear chart layouts make it functional, even with some of the free plan’s limitations.
Feature Accessibility for Free Users
While StockCharts.com offers several key features for free users—like charting tools, technical indicators, and drawing tools—it does limit some advanced options. Free users are restricted to three indicators per chart, can’t save workspaces, and cannot access historical price data beyond ten years. Nevertheless, the platform still provides valuable free tools for basic charting without complex features.
Comparison Table
| Charting Software | Overall Rating | Charting Tools & Technical Analysis | User Experience | Feature Accessibility for Free Users | Pricing |
|---|---|---|---|---|---|
| ProRealTime | 90% | Unlimited indicators, multi-timeframe support | Highly customizable, distraction-free interface | Core features accessible, no paywalls for key tools | Free |
| TradingView | 86% | Solid tools but limited to 3 indicators for free users | Sleek, responsive, but frequent upgrade prompts | Limited to one chart layout, 3 indicators per chart | Free / from $14.95/mo |
| Yahoo Finance | 85% | Essential tools, surprisingly good for a free platform | Simple, less intuitive compared to chart-focused platforms | Free real-time data, but ads and fewer customization options | Free / from ~$9/mo |
| Koyfin | 83% | Basic tools, better for financial data and visualization | Sleek and modern, strong data visualization | Basic charting tools, advanced features behind paywalls | Free / from $39/mo |
| StockCharts | 80% | Reliable, limited to 3 indicators per chart | Old-school but functional, easy to navigate | Free version limited by ads, fewer indicators, no saved workspaces | Free / from $19.95/mo |
Prices may change. Check each platform’s website for the latest pricing.
Free Charting Through Brokers
One alternative option you can consider is opening an account with brokers like Interactive Brokers, Thinkorswim, or Webull. These accounts give you access to their built-in charting tools, which are integrated with their trading platforms for seamless trading and analysis.
If you prefer more control, platforms like ProRealTime and TradingView offer integration with multiple brokers, allowing you to keep your preferred chart layout even if you switch brokers. This gives you more flexibility without losing your setup.
Frequently Asked Questions
What is the best free stock chart?
ProRealTime Web scored highest in our testing. It gives you unlimited technical indicators, multi-chart layouts, and a clean interface with no ads or upgrade prompts. TradingView and Yahoo Finance are solid alternatives, though both limit free users more heavily.
Is there a free version of TradingView?
Yes, but it’s limited. Free users get one chart per tab, two indicators max, and frequent upgrade prompts. For features like multi-chart layouts or more indicators, you’ll need a paid plan starting at $14.95/mo. That said, platforms like ProRealTime give you many of those features at no cost. We compared several options in our TradingView alternatives guide.
Which free stock charts have the most indicators?
ProRealTime Web gives you unlimited indicators on its free plan, with no cap on how many you can overlay on a single chart. TradingView limits free users to two indicators per chart, and StockCharts caps it at three. If technical analysis depth matters to you, that difference adds up fast.
Do I need to pay for charting software?
Not necessarily. All five platforms on this list have a free tier. ProRealTime Web stands out because its free plan includes features that most competitors lock behind a paywall: unlimited indicators, multi-chart layouts, and no ads. The trade-off with other free plans is usually fewer indicators, restricted layouts, or upgrade prompts.
Final thoughts
When it comes to free charting software, the right choice depends entirely on your trading style. Want deep customization and advanced tools all for free? ProRealTime is a top pick.
Looking for community insights and easy charting? TradingView delivers. Need something simple and reliable? Yahoo Finance and StockCharts have you covered. And if you’re after a mix of data visualization and technical analysis, Koyfin stands out.
At the end of the day, the best platform is the one that fits how you trade. So, what’s next?
Explore these tools, try them out, and find the one that helps you analyze markets and make smarter trades.

Othmane has been swing trading for years and builds on experience in investment banking. He writes regularly about trading and market analysis, and has passed Level I of the CFA Program along with earning a double Master’s degree in Financial Analysis.