What Is a Moving Average? A Practical Guide for Traders


Moving averages are one of the most widely used indicators in trading — and for good reason.
They help smooth out price action, highlight the direction of a trend, and signal potential entry or exit points.
In this guide, we’ll dive into moving averages, what they are, which settings to use, and use cases for the different types you’ll come across (like SMA and EMA).
Whether you’re just starting out or looking to strengthen your technical analysis skills, this guide aims to give you a practical understanding of how moving averages work and when to use them.
Let’s dive in.
The direction, slope, and crossovers of moving averages can provide useful buy and sell signals.
While a moving average doesn’t guarantee a statistical edge in the markets, it gives traders an objective reference point to base decisions on.
A 20-period moving average means something very different on a 1-minute chart vs. a daily chart — same number, totally different context.
Different types (SMA, EMA, WMA, TMA) respond to price differently — and the one you choose can change what you see.
What Is a Moving Average (MA)?
Moving averages bring structure to chaotic price action. They help traders focus on the broader trend instead of reacting to every minor spike or dip.
By averaging out past prices, moving averages smooth short-term volatility and make it easier to see whether the market is trending up, down, or sideways.
Most charting platforms calculate them automatically and display them as curved lines over the price chart.
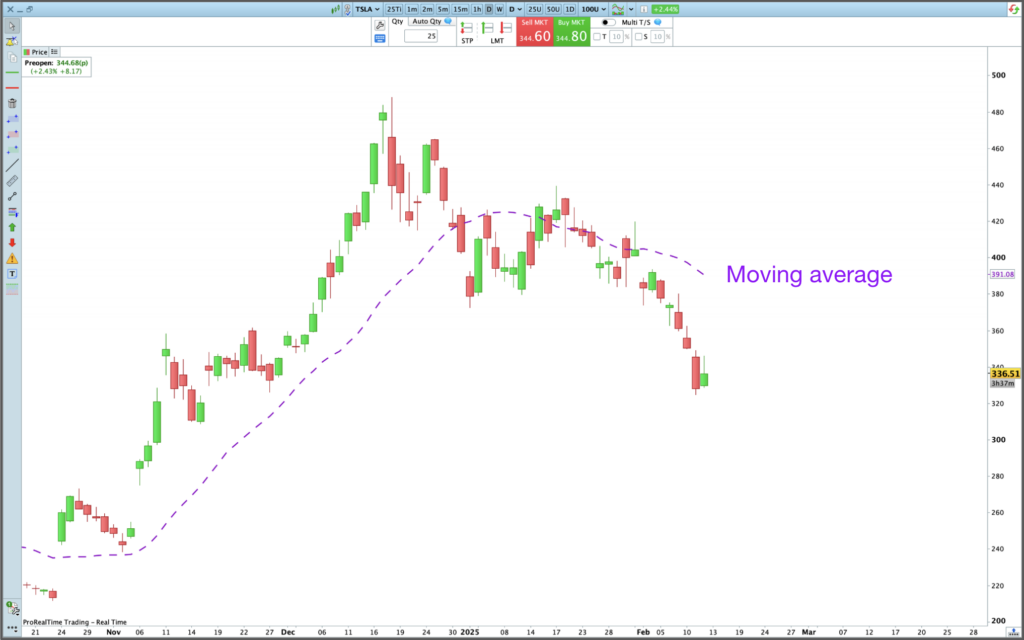
Most trading platforms calculate them automatically and plot them as curved lines directly on your chart. But how that line behaves depends on one key setting: the period.
The period tells the moving average how many candles to include in its calculation. A 7-period moving average on a daily chart, for example, averages the closing prices of the last 7 trading days, updating with each new candle.
But here’s the thing: the same period setting can mean very different things depending on the chart you’re using.
- On a daily chart, a 20-period average covers 20 days
- On a 1-hour chart, it covers just 20 hours
Same number of periods — completely different time horizon.
Shorter periods make the moving average more sensitive. A 10-period average will hug the price closely and highlight short-term moves. Longer periods, like 50, 100, or 200, create a smoother line that filters out noise and reveals the broader trend.
Your settings should reflect your time horizon and your overall trading plan.
Different Types of Moving Averages
If all moving averages track the trend, why are there so many types?
Because each one reacts to price in a slightly different way. Some respond quickly to recent moves. Others smooth out short-term fluctuations. And that difference can affect how clearly you see a trend, or how easily you get faked out.
To show how this works in practice, here’s a chart comparing four different 20-period moving averages on a daily chart:

In this example:
- The exponential and weighted averages follow price more closely.
- The simple and triangular averages are smoother and slower to react.
Each line tells a slightly different story — and that’s exactly why these variations exist.
But that story doesn’t mean much without context. The way a moving average behaves depends not just on its type, but also on the period you choose and what the price is doing.
If the market is reversing or gaining momentum,a faster average might help you spot that shift earlier. If the trend is already established, a slower, smoother line can help you stay in it longer without reacting to every pullback. And when there’s no clear direction, both can give misleading signals.
That’s why different types exist: not because one is better than the others, but because each gives you a different lens to read the market, depending on how you trade and what you’re trying to see.
Which Type of Moving Average Should You Choose?
Some focus more on recent candles, others smooth everything out. Below, you’ll find a quick comparison to help you understand how they differ, and what they’re best suited for.
| Type | How it behaves | How it’s calculated | Typical use case |
|---|---|---|---|
| Simple (SMA) | Smooths price evenly across the period. Slower to react, but stable | Average of all closing prices over the period | Often used with 50- or 200-period settings to track overall trend or dynamic support/resistance |
| Exponential (EMA) | Reacts faster by giving more weight to recent prices. More responsive | Uses a multiplier to emphasize recent prices more heavily | Common in 9-, 12-, or 21-period setups for short-term trades or early momentum |
| Weighted (WMA) | Strong emphasis on recent candles. Can be very sensitive to price spikes | Applies custom weights to each candle, recent ones weighted more | Useful for precise timing in fast setups like pullbacks or scalping |
| Triangular (TMA) | Double-smoothed. Slowest to react. Filters out more noise | Applies an SMA twice (average of the average) | Used to smooth out long-term trend structure. Not ideal for entry signals |
Most platforms offer a wide range of moving average types — from Hull to least squares to time series models. These are designed to reduce lag, improve reactivity, or fine-tune price smoothing in different ways.

But in practice, the simple and exponential moving averages remain the most commonly used. They’re widely supported, easy to interpret, and more than enough for most trading strategies.
Moving Averages Settings
Choosing a type of moving average is only part of the equation. To make it useful, you also need to set it up properly — especially the period, which controls how reactive or smooth the line will be.
The period tells the moving average how many candles to include in the calculation. The smaller the number, the faster and more reactive the line. The larger the number, the slower and smoother it becomes.

This sensitivity should match your trading style and the behavior of the market you’re trading.
- In fast, volatile markets, a slower-moving average can help filter out noise.
- In calmer or more trending markets, a faster average might help you catch shifts earlier.
Some of the most commonly used periods are: 3, 5, 7, 10, 20, 50, 100, and 200. But some traders prefer using numbers from the Fibonacci sequence — like 8, 13, 21, 34, 55, 89, or 144 — as a more customized approach.
You can also combine two moving averages with different periods — a shorter one to track recent price action, and a longer one to follow the overall trend. This is the foundation of many crossover strategies, where traders watch for the faster line crossing above or below the slower one as a potential trading signal.
Most platforms also let you choose which price the moving average is based on — close, open, high, or low. The closing price is the most common, as it reflects where the market settled during each candle.
Moving Averages Trading Strategies
Moving averages don’t predict price, but they can help bring structure to your trades.
When part of a broader analysis — like price action or momentum — they can inform your trading plan.
Here are a few common ways moving averages are used in real strategies.
#1 – Identifying Trend Direction with Moving Averages
Moving averages make it easier to spot the trend. But they also help you understand where price is in relation to that trend — whether it’s holding, pulling back, or bouncing temporarily.

Traders usually pay attention to two things:
- Is the moving average sloping up or down?
- Is price above or below it?
That combo offers a simple, visual insight into trend context.
| Moving average direction | Price action (relative to MA) | What it suggest |
|---|---|---|
| 🔼 Uptrend | Above | Buyers are in control — the trend is up and holding |
| Below | Price is pulling back — some traders watch to see if buyers step back in | |
| 🔽 Downtrend | Below | Sellers are in control — the trend is down and holding |
| Above | Price is bouncing, but sellers may still have the upper hand |
Don’t treat moving averages as hard rules.
They’re technical indicators — imperfect by nature — and won’t always act as exact or reliable boundaries. In volatile markets or ranging markets, the price can cross above or below them without breaking the trend.
Always take them with a grain of salt, they’re guides, not guarantees.
#2 – Using Moving Averages as Dynamic Support and Resistance
Moving averages can also act as dynamic support or resistance, depending on the trend.

It’s not an exact science — but many traders use moving averages as reference points to anticipate where price might react.
- In an uptrend, a rising moving average often sits below price. When price pulls back, it may bounce off the average and continue higher as buyers step in.
- In a downtrend, it’s the reverse. A falling moving average often sits above price. When price rallies into it, it can get rejected and turn lower as sellers regain control.
Some traders use several moving averages together to create a ribbon. Instead of relying on a single line, they watch how price reacts to the whole band, which can act as a dynamic support or resistance zone.
#3 – Spotting Momentum Shifts with Moving Average Crossovers
One common way traders use moving averages is by watching for crossovers — when a fast-moving average crosses over a slower one. These crossovers can signal a possible shift in trend and are often used to time entries or exits.

- A bullish crossover happens when a shorter moving average moves above a longer one. It can suggest that momentum is shifting to the upside, and some traders see it as a possible buy signal.
- A bearish crossover is the opposite, the shorter moving average dips below the longer, which may hint at growing selling pressure and potential downside.
The golden cross and death cross are two of the most watched moving average signals — especially on daily charts. A golden cross happens when the 50-day moving average crosses above the 200-day. Many traders see it as a sign that momentum is shifting to the upside. A death cross is the opposite: the 50-day drops below the 200-day, which can point to building downside pressure.
Pros and cons of moving averages
Like any technical tool, moving averages come with strengths and limitations. They’re simple to use and widely followed, but they’re not magic — and they work best when used in the right context.
| Advantages | Drawbacks |
|---|---|
| Simple and visual trend indicator | Can produce frequent false signals |
| Helps place trailing stop-loss orders | Doesn’t offer a proven statistical edge on its own |
| Customizable period to fit your trading style | May lag behind price, especially in fast markets |
Final thoughts
Moving averages won’t predict the future or give you perfect signals. They’re not meant to work in isolation. Like any technical indicator, they’re most effective when used as part of a system you’ve backtested and understand.
If you’re serious about refining your strategy, learning how to use moving averages well is a practical step toward making smarter, more disciplined trading decisions.
FAQ
What Are the Major Moving Averages?
The 4 most commonly used moving averages are:
Simple Moving Average (SMA): A basic average of past prices.
Typically used by longer-term traders who want a stable, less reactive trend line.
Exponential Moving Average (EMA): Gives more weight to recent prices, making it quicker to respond.
Popular among day traders and swing traders who need faster signals.
Weighted Moving Average (WMA): Uses custom weights for each price point, emphasizing the most recent data.
Sometimes used in short-term strategies that require precise timing.
Triangular Moving Average (TMA): Smoothed twice, making it very slow and steady.
Used by traders who want to focus on the broadest trend and filter out noise.
How do I Calculate a Moving average?
To calculate a simple moving average (SMA), you add up the closing prices of the last N periods and divide by N.
For example, a 10-period SMA on a daily chart would be:
Add the closing prices of the last 10 days, then divide by 10.
That gives you one point. The average is updated with each new candle, creating the moving line you see on the chart.
Other types — like the exponential or weighted moving averages — use formulas that give more importance to recent prices. But in most cases, your charting platform handles the math for you automatically.
Are Moving Averages a Good Indicator?
The short answer is that it depends on how you use it.
Moving averages won’t predict price, and backtesting shows they don’t offer a strong edge on their own. They lag behind price and can give false signals.
Which Setting is Best For the Moving Average indicator?
There isn’t a universal best, but some settings are used far more often than others.
20-period moving averages are commonly used to track short-term trend swings.
50-period is a go-to for medium-term structure, especially on daily charts.
200-period is often used to define the long-term trend and is closely watched by institutional traders.
Your choice should match your timeframe and how fast you want the average to react. Day traders might use a 9 or 21 EMA on 5-minute or 15-minute charts, while swing traders often rely on a 20 or 50 SMA on the daily.
There’s no magic number — but copying what experienced traders use can be a good place to start.

Maxime holds two master’s degrees from the SKEMA Business School and FFBC. As founder and editor-in-chief of NewTrading.fr, he writes daily about financial trading.


7 Popular Swing Trading Strategies with Practical Examples


The Most Popular Chart Patterns in 2026