Products featured on our site may be from partners who compensate us. For more details, see our editorial policies.
Maxime holds two master’s degrees from the SKEMA Business School and FFBC: a Master of Management and International Financial Analysis. As the founder and editor-in-chief of NewTrading, he writes daily about financial trading.
Cedric is an experienced investment strategist with over 10 years at TTUTC. He holds both the CMT and CFA designations.
Othmane holds dual Master’s degrees in Financial Analysis and has successfully completed Level 1 of the Chartered Financial Analyst (CFA) Program. He leverages his academic background alongside several years of hands-on experience in reviewing and editing finance-related content.
Is RSI better than MACD? Are Bollinger Bands more reliable than Donchian Channels? And when it comes to moving averages, does the exponential version really outperform the simple one?
We had the same questions. So, we put the most popular technical indicators to the backtest, analyzing nearly a century of market data to see which ones hold up.
The results? We ranked them into three categories: the most reliable technical indicators, known for their high win rates and accuracy; the most consistent indicators, which delivered steady gains over time; and the highest-performing indicators, maximizing overall returns.
Curious to see where your favorite trading indicators stand? Let’s dive in.
Wondering whether technical analysis itself works at all? Here’s what the research says.
Key Takeaways
The results here are based on 100 years of Dow Jones data, using simplified assumptions, offering a strong starting point for exploration.BacktestingThe process of testing a trading strategy using historical market data to see how it would have performed in the past. This helps traders evaluate the strategy’s effectiveness before risking real money.your own strategies with specific parameters and context is always a good idea.
RSI andBollinger BandsA volatility indicator that uses three lines: a simple moving average and two standard deviation bands, which expand or contract based on market volatility.proved to be the most reliable indicators, consistently delivering high win rates across both testing periods.
Donchian ChannelsA trend-following indicator that plots the highest high and lowest low over a set number of periods, creating an upper and lower channel for price action.and Williams %R (Williams Percent Range)An oscillator that measures the closing price relative to the high-low range over a set period, helping identify overbought or oversold levels. stood out for their consistency, maintaining steady performance over time in real-world and controlled conditions.
IchimokuA comprehensive indicator that provides trend, support/resistance, and momentum information using multiple components like Senkou Span and Tenkan-Sen. andEMA (Exponential Moving Average)A moving average that gives more weight to recent prices, making it more responsive to current market trends compared to the simple moving average.emerged as the highest-performing indicators, delivering the best overall returns by balancing accuracy and profitability.
No single indicator works perfectly in every situation—choose the one that aligns with your trading style, whether you value reliability, consistency, or maximizing returns.
Disclaimer
Trading carries significant risks, including the potential loss of your initial capital or more. Most traders lose money, and trading is not a guaranteed path to wealth. Products like FOREX and CFDs are complex and involve leverage, which can magnify gains and losses. CFD trading is banned in many countries, including the United States.
Our Methodology
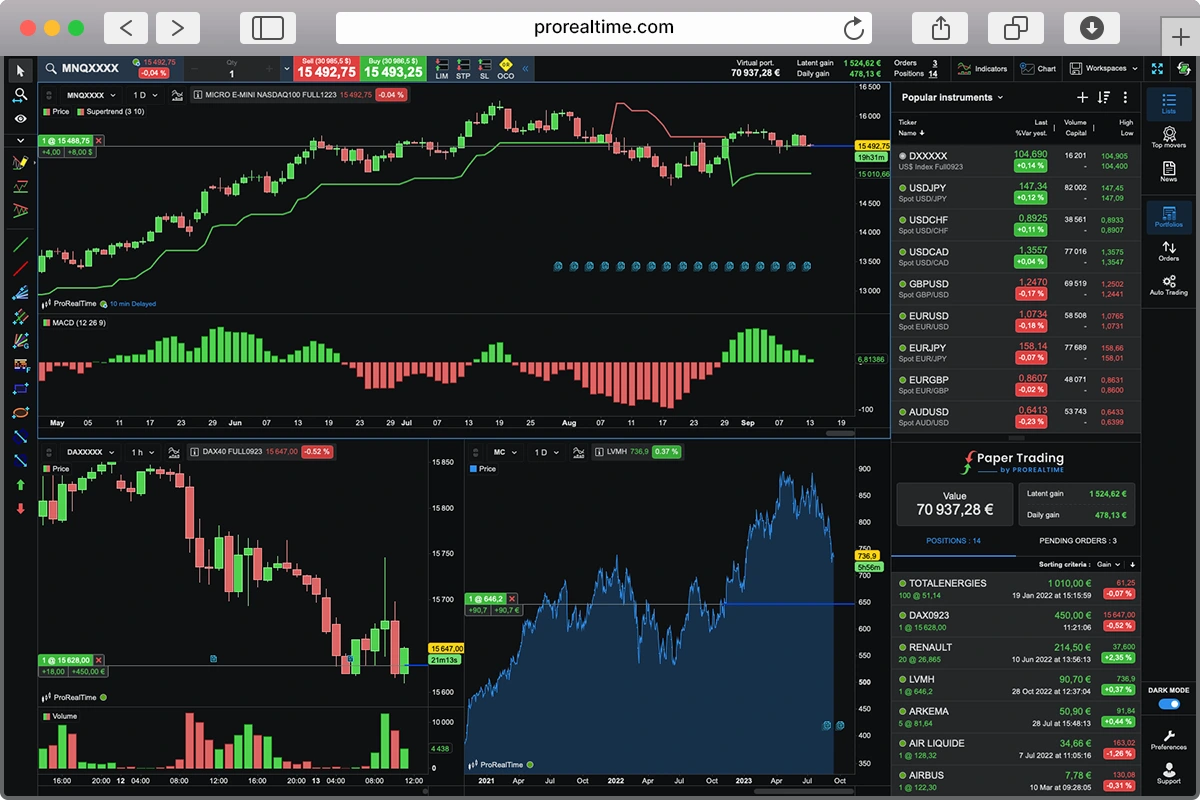
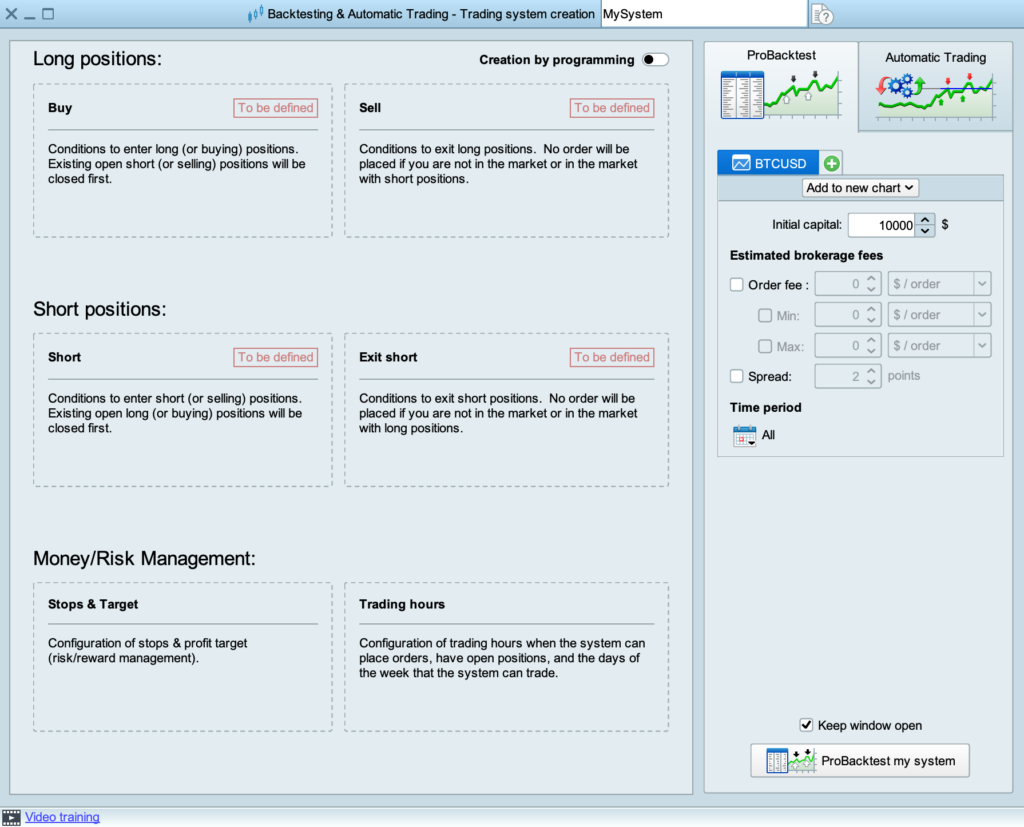
Finding the best technical indicators isn’t easy—but that’s exactly why we took on the challenge. Using ProRealTime’s backtesting tool, we aimed to discover which indicators truly stand out.
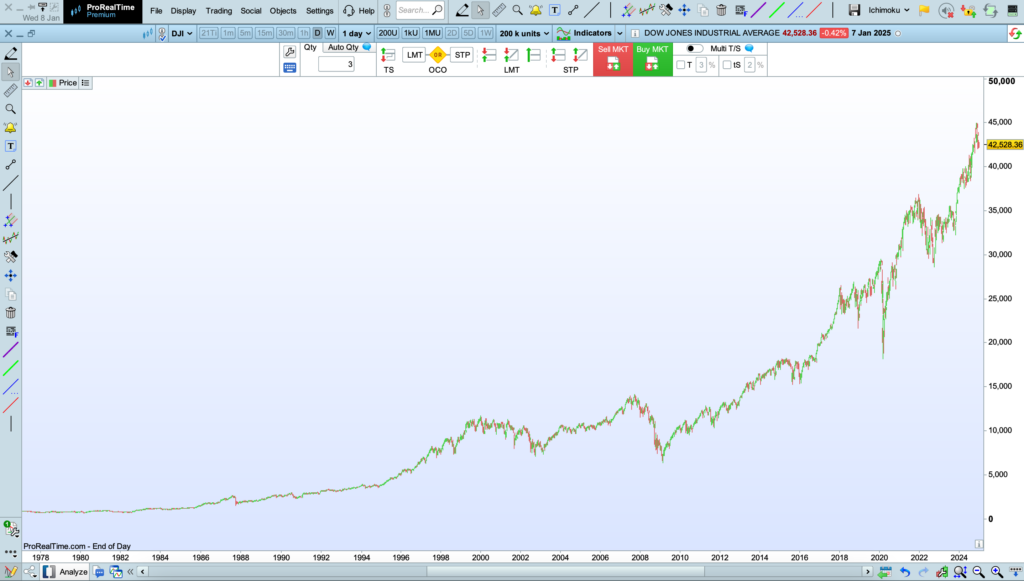
To ensure we worked with data that’s rich and meaningful, we focused on the Dow Jones Industrial Average (DJIA)—a stock market index with over a century of history.
To make the test as reliable as possible, we analyzed nearly 100 years of Dow Jones Industrial Average data. We split the timeline into two phases:
In-Sample Period (October 1, 1928 – December 31, 1995): We used this period to develop and refine the strategies.
Out-of-Sample Period (January 2, 1996 – December 31, 2024): This was the real-world test. We applied the strategies to this new data to see if they held up.
Why split the timeline?
Using the same data to build and test strategies can lead to overfitting—where a strategy is too tailored to the past and fails in the future.
By splitting the timeline, we tackled this issue head-on. The In-Sample Period allowed us to test ideas and optimize performance using historical data, while the Out-of-Sample Period served as the real-world test, showing how the strategies performed on unseen data.
For simplicity, every strategy we tested was long-only, meaning we only took positions when the signals pointed to buying opportunities. And, to keep things straightforward, each trade represented a single unit of the index.
The amount of fake money used was $10,000, and the trades were done without any leverage.
The goal? To find the technical indicator that performs best over nearly a century of market data. It’s been an exciting journey digging into the data and uncovering actionable insights from the results.
How Trading Signals Were Assigned to Indicators
We kept the trading signals straightforward, reflecting how these indicators are commonly used in real-world scenarios:
Technical indicator
Buy signal
Exit Buy signal
Simple Moving Average (50)An average of the last 50 closing prices, plotted on a chart to smooth out short-term fluctuations and identify trends.
Bullish MA
Bearish MA
Exponential Moving Average (50)A moving average that gives more weight to recent prices, making it more responsive to current market changes.
Bullish EMA
Bullish EMA
RSI (14)The Relative Strength Index measures the speed and change of price movements over 14 periods to identify overbought or oversold conditions.
RSI less than or equal to 30
RSI greater than or equal to 70
MACD(12,26,9)The Moving Average Convergence Divergence indicator shows the relationship between two moving averages (12 and 26 periods) and includes a 9-period signal line for crossovers.
MACD bullish crossover and its signal
MACD bearish crossover and its signal
Stochastic (14,3,5)An oscillator that compares a security’s closing price to its price range over 14 periods to identify overbought and oversold conditions.
Bullish stochastic crossover and its signal
Bearish stochastic crossover and its signal
Bollinger Bands (20,2)Three lines plotted on a chart: a simple moving average (20) and two standard deviation bands that expand or contract based on market volatility.
Price lower than the lower limit
Price higher than the upper limit
Donchian Channels (20)A trend-following indicator that plots the highest high and lowest low over the last 20 periods, creating an upper and lower channel.
Price higher than the upper limit
Price lower than the lower limit
Parabolic SAR (0.02, 0.02, 0.2)A trend-following indicator that places dots above or below price bars to signal potential reversals based on price acceleration factors.
SAR green line
SAR red line
Ichimoku (9,26,52)A comprehensive indicator with multiple components, including Senkou Spans, to identify trends, support/resistance levels, and momentum.
Price higher than Senkou Span B
Price lower than Senkou Span A
ADX (14)The Average Directional Index measures trend strength over 14 periods, with higher values indicating stronger trends.
ADX ADXR crossover indicating an upside trend
ADX ADXR crossover indicating a downside trend
Williams Percent Range (%R) (14)An oscillator that compares the current price to the highest high over 14 periods, helping identify overbought or oversold conditions.
Buy at an oversold level
Sell at an overbought level
Commodity Channel Index (CCI) (20)An oscillator that measures price deviations from a moving average over 20 periods to identify overbought or oversold levels.
Buy at an oversold level
Sell at an overbought level
Momentum (12)Measures the rate of change in an asset’s price over 12 periods to identify the strength and direction of a trend.
Moves into positive territory
Moves to negative territory
TRIX (15,9)A triple-smoothed exponential moving average of closing prices over 15 periods, designed to filter out short-term noise and identify momentum changes.
Moves into positive territory
Moves to negative territory
Limitations to the Methodology
Every methodology has its quirks, and ours is no exception. While our approach to analyzing the Dow over nearly a century is robust, there are a few limitations worth keeping in mind to fully appreciate the results.
By focusing solely on the Dow, we inevitably faced survivorship bias since the index evolves over time with only successful companies sticking around.
Additionally, limiting ourselves to long-only strategies means we missed out on opportunities to explore the bearish side of the market, while fixed position sizing left no room to adapt for volatility or price swings.
Transaction costs, slippage and bid-ask spreads were left out of the equation, and overfitting is always a concern. Plus, evaluating just one index doesn’t capture the full breadth of market behavior or how strategies and indicators might perform across different sectors or asset classes.
The Results
Warning
Past performance doesn’t guarantee future success—markets evolve over time. We tested one type of buy-and-exit system, but many variations could yield different insights. While the methodology is solid, it’s not flawless. These aren’t dealbreakers, but they’re important to consider as you interpret the findings.
In-Sample Results: October 1, 1928, to December 31, 1995
Strategy
Win Rate
Average Gain
Average Loss
Gain/Loss Ratio
Return Rate
SMA (50)
30.85%
4.03
0.96
4.2
1.6
EMA (50)
31.27%
3.76
0.74
5.08
1.9
RSI (14)
71.64%
5.12
5.89
0.87
1.34
MACD
37.56%
7.46
2.6
2.87
1.45
Stochastics
46.28%
1.62
1
1.62
1.21
Bollinger Bands
74.32%
3.83
4.95
0.77
1.32
Donchian Channels
70.00%
3.41
4.58
0.74
1.22
Ichimoku
46.00%
6.87
1.68
4.09
2.34
Parabolic SAR
45.10%
2.39
1.69
1.41
1.09
ADX
53.32%
2.82
1.95
1.45
1.3
WPR
69.66%
2.34
2.55
0.92
1.34
CCI (20)
34.60%
4.66
1.2
3.88
1.69
Momentum
42.55%
2.57
1.18
2.18
1.35
Trix (15, 9)
42.93%
8.11
3
2.7
1.59
Out-of-Sample Results: January 2 1996 to December 31 2024
Strategy
Win Rate
Average Gain
Average Loss
Gain/Loss Ratio
Return Rate
SMA (50)
26.25%
71.25
17.22
4.14
1.35
EMA (50)
30.07%
61.75
18.48
3.34
1.31
RSI (14)
87.11%
116.5
150.74
0.77
1.54
MACD
42.70%
103.71
51.69
2.01
1.28
Stochastics
43.42%
31.64
19.47
1.63
1.14
Bollinger Bands (BB)
81.25%
68.48
95.21
0.72
1.4
Donchian Channels
78.26%
53.73
75.58
0.71
1.34
Ichimoku
38.68%
81.92
38.74
2.11
1.2
Parabolic SAR
44.25%
50.6
31.55
1.6
1.15
ADX
53.81%
46.68
38.58
1.21
1.19
WPR
73.66%
38.87
55.68
0.7
1.25
CCI (20)
35.69%
72.13
29.12
2.48
1.24
Momentum
40.65%
39.49
18.72
2.11
1.26
Trix (15, 9)
44.32%
104.85
55.62
1.89
1.28
Which Technical Indicators are the Most Reliable?
As it relates to the most reliable technical indicators, it’s all about their ability to maintain a high win rate both in the in-sample and out-of-sample periods.
These are the indicators that you can rely on to call the right shots, proving their worth not just in controlled testing but also in the unpredictable twists and turns of real market conditions. High reliability like this is what separates the truly dependable tools from the rest.
Technical Indicator
Win Rate
RSI(14)
79.4%
BB
77.8%
Donchian Channels
74.1%
WPR
71.7%
ADX
53.6%
Stochastics
44.9%
Parabolic SAR
44.7%
Trix(15,9)
43.6%
Ichimoku
42.3%
Momentum
41.6%
MACD
40.1%
CCI(20)
35.1%
EMA(50)
30.7%
SMA(50)
28.6%
Which Technical Indicators Are the Most Consistent?
When we talk about “most consistent” technical indicators, we’re looking for the ones that deliver a solid average gain across the board – both in the in-sample and out of sample periods. These are the indicators that prove themselves over time, not just in ideal conditions but also when tested against the unpredictability of real-world markets. High average gains in both periods are the true hallmark of a consistent performer.
Technical Indicator
Win Rate
RSI(14)
79.4%
BB
77.8%
Donchian Channels
74.1%
WPR
71.7%
ADX
53.6%
Stochastics
44.9%
Parabolic SAR
44.7%
Trix(15,9)
43.6%
Ichimoku
42.3%
Momentum
41.6%
MACD
40.1%
CCI(20)
35.1%
EMA(50)
30.7%
SMA(50)
28.6%
Which are the Best Technical Indicators?
For us, the best technical indicators are those that deliver the highest return rate, which we calculate using a straightforward formula:
Return Rate = Win Rate x(Average Gain/Average Loss + 1)
This approach balances how often the indicator wins trades with the size of the average profits versus losses, giving us a clear picture of overall effectiveness.
It’s not just about winning often-it’s about making sure the wins outweigh the losses in a meaningful way.
Technical Indicator
Return Rate
Ichimoku
1.77
EMA(50)
1.60
SMA(50)
1.48
CCI(20)
1.47
RSI(14)
1.44
Trix(15,9)
1.43
MACD
1.37
BB
1.36
Momentum
1.31
WPR
1.29
Donchian Channels
1.28
ADX
1.25
Stochastics
1.18
Parabolic SAR
1.12
Final thoughts
Technical indicators are powerful tools, but their effectiveness depends on how, when, and where you use them. The rankings in this article provide a strong starting point, but they’re not a one-size-fits-all solution.
Markets evolve, and so should your approach. Backtesting your strategies on different assets, time frames, and conditions is crucial to finding what works best for you. Whether you prioritize reliability, consistency, or high returns, success lies in understanding the strengths and limitations of each tool—and continuously refining your approach.
Want to see how these indicators perform with your trading style? Backtesting software like ProRealTime let you test and fine-tune strategies with just a few clicks. Take the insights from this study and make them work for you.
Stay curious, stay adaptable, and remember: the best traders aren’t those who find perfect tools but those who use them wisely.
Maxime holds two master’s degrees from the SKEMA Business School and FFBC. As founder and editor-in-chief of NewTrading.fr, he writes daily about financial trading.


 Warning