How to Use Fibonacci Retracement and Extension Levels in Trading


Ever used Fibonacci levels and felt unsure if you were doing it right?
Retracement and extension levels are built into almost every charting platform. They’re not meant to predict exact turning points — but they can help you mark out areas where price might react.
This guide explains how they work, what they’re good for, and how to use them without overcomplicating your charts.
Fibonacci levels mark potential zones where price could react — not magic numbers, but reference points many traders watch.
Retracement levels (like 38.2%, 50%, and 61.8%) help spot possible pullbacks before a trend resumes.
Extension levels (like 100%, 161.8%, and 200%) help map out areas where price might run out of steam or take profit zones might cluster.
Fibonacci levels are everywhere — built into charting tools and even used by trading bots — but that doesn’t make them bulletproof. Always use them with context.
Understanding Fibonacci Levels
Fibonacci levels are built into most charting tools — and for good reason. They help mark potential support or resistance zones, based on ratios from a centuries-old number sequence.
We’ll leave the math lesson for another time. What matters here is how traders use these levels to spot areas where price might pull back, bounce, or accelerate.
There are two types worth knowing:
- Retracements map possible pullback zones within a trend — think 38.2%, 50%, 61.8%.
- Extensions project where price might go after the pullback — like 100%, 161.8%, or 200%.
Used together, they give structure to your chart: helping you plan more informed entries, exits, and targets.
Fibonacci Retracements and Their Best Uses
Fibonacci retracements help traders spot areas where price might pause or bounce after a sharp move. They’re often used to estimate how far a pullback could go before a trend resumes — or reverses entirely.
- In an uptrend, retracement levels can act as support during a pullback.
- In a downtrend, they may act as resistance during a bounce.
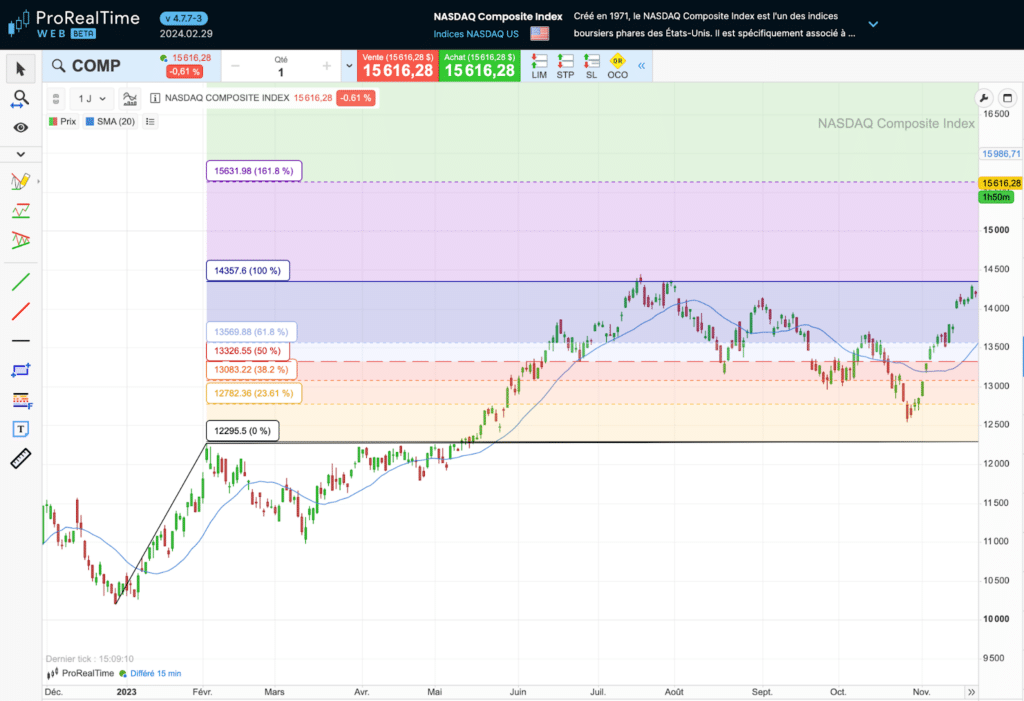
Here’s an example of a retracement after a downtrend:

These levels don’t give precise buy or sell signals on their own, but many traders use them to spot areas worth watching, especially when price aligns with other technical indicators.
| Fibonacci Retracement Level | What It Suggest |
|---|---|
| 23.6% | First minor retracement level |
| 38.2% | Moderate retracement, common for shallow pullbacks |
| 50% | Psychological midpoint, not a Fibonacci ratio but widely used |
| 61.8% | The “Golden Ratio,” key retracement level |
| 76.4% | Deeper retracement, used less frequently |
While 100% isn’t a retracement level in the traditional sense, many traders watch it as a key point of resistance or support when price completes a full reversal.
Fibonacci Extension Levels and Their Best Uses
Fibonacci extensions are used to identify potential endpoints of a price movement following a retracement. They help predict where the price might go next, especially when it extends beyond its previous highs or lows.
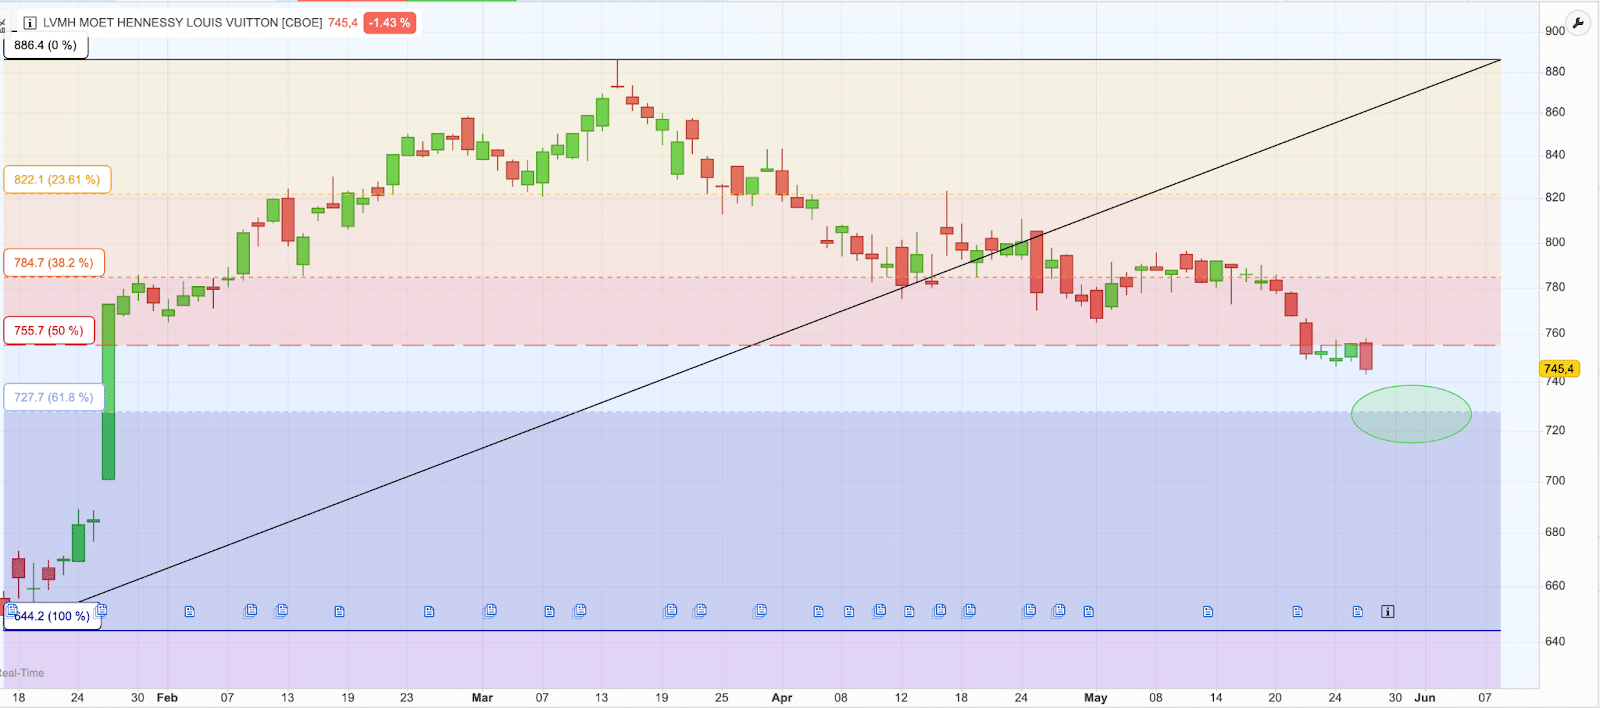
Example of an extension during an uptrend:
- If the initial movement is upward, Fibonacci extension levels will likely act as resistance during a new upward price impulse. These levels may provide sell signals for traders.
- Conversely, if the initial movement is downward, Extension levels are likely to serve as support during a new downward price impulse. These levels may provide buy signals for traders.
| Fibonacci Extension Level | Common Usage |
|---|---|
| 100% | Primary target for the continuation of the trend |
| 138.2% | First extension level beyond 100%, used for strong trends |
| 161.8% | This is the “golden extension” level and is often used as the first major profit-taking point in strong trending markets. |
| 200% | Often used in highly volatile markets or very strong trends |
| 261.8% | Extended target used in exceptionally strong trend scenarios |
How to Draw Fibonacci Retracements
- Identify Peaks and Troughs
Look for sections of the chart where the price makes a sharp, distinct move upwards or downwards. An impulse move usually starts from a low point (swing low) and reaches a high point (swing high) in bullish scenarios or the opposite in bearish scenarios. - Use a Drawing Tool
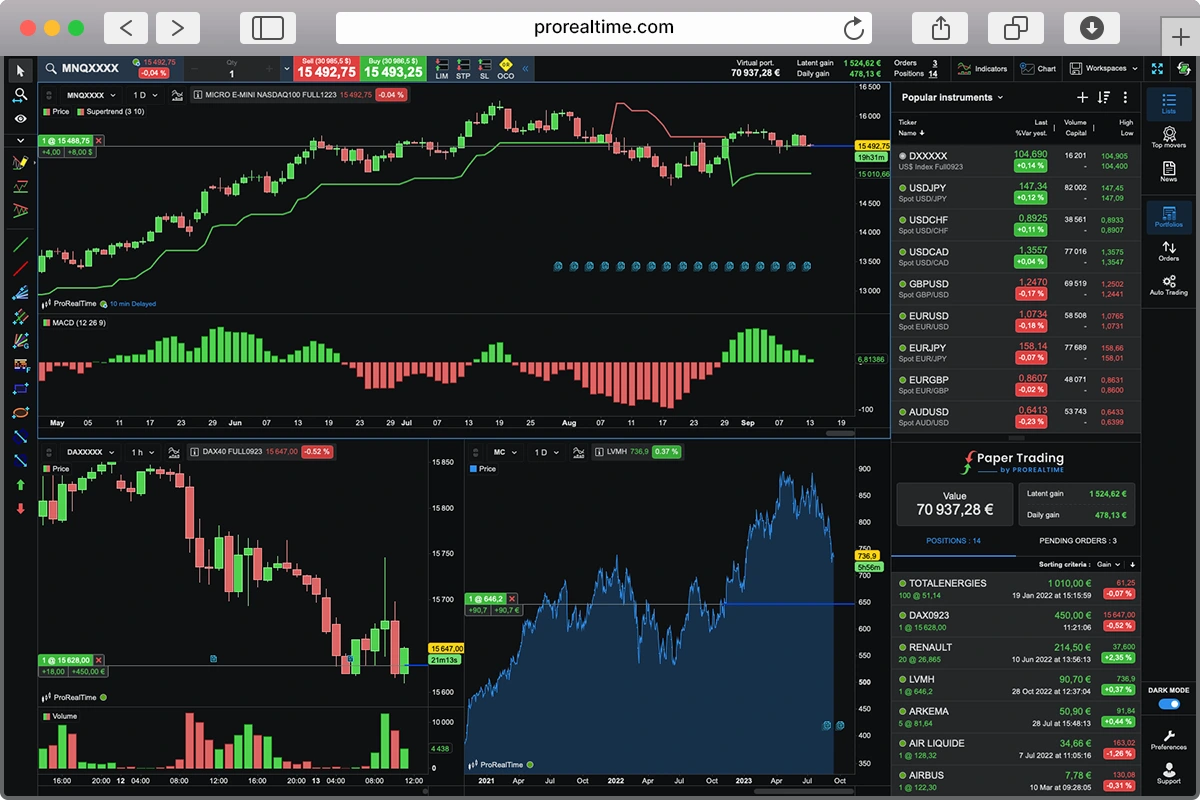
The best paper trading platforms offer a Fibonacci drawing tool. To display the key Fibonacci levels automatically, simply click on the movement’s starting point and then on its endpoint.
You can customize the drawing tool to display additional levels, or alternatively, hide certain Fibonacci levels to prevent your chart from becoming overloaded with information!
Advantages and disadvantages of Fibonacci tools
Let’s break down the advantages and disadvantages of Fibonacci tools.
Pros
-
Applicable to all markets. Use Fibonacci tools across stocks, forex, and commodities.
- User friendly. Easily draw them with ProRealTime or other charting softwares
-
Spot key levels. Identify potential support and resistance levels where the price might reverse
-
Integrates well into trading algorithms. Great for planning trades.
Cons
- Highly subjective. Two traders might draw them differently on the same chart.
- Inconsistent predictions. Sometimes the market blows right past them, which can lead to false signals.
- Chart clutter. Too many “Fib” levels can make charts messy and analysis complicated.
- Retrospective nature. Since Fibonacci tools are based on past price action, they might not always predict future movements, especially in volatile or news-driven markets.
How to Trade with Fibonacci
Fibonacci retracements and extensions are used to trade markets with a clear upward or downward trend. Market pullbacks to retracement levels offer traders opportunities to enter positions in the direction of the trend.
A common technique is to enter at a retracement level and then target an extension level, betting on the continuation of the trend.
Stop-loss orders are typically placed below the Fibonacci retracement level to cut losses automatically if the price falls through this level.
Practical Example: Fibonacci Retracements
Fibonacci Retracements and Extensions: Understanding the Differences
Fibonacci retracements are levels that indicate where a current trend may temporarily reverse or pull back. Essentially, these levels show potential spots where the price might retrace a portion of its recent move before continuing in the original direction.
Fibonacci extensions, on the other hand, are used to predict where a current trend might continue beyond its original high or low. These levels are helpful for determining where the trend could extend after surpassing the endpoint of its initial movement.
After an upward move, retracements mark lower price levels than the initial move’s peak, where the price might fall back to before resuming the uptrend. Extensions indicate higher price levels beyond the peak, where the price could potentially rise to.
After a downward move, retracements mark higher price levels than the initial move’s low, where the price might rise back to before continuing the downtrend. Extensions indicate lower price levels below the low, where the price could potentially fall to.
Building a Trading Plan Using Fibonacci
Mastering Fibonacci tools starts with identifying the right swing highs and lows. This can feel like an art, so focus on clear, significant price movements. Use multiple timeframes to confirm key levels. With practice, it becomes second nature.
Combine Fibonacci with other tools like trend lines, support and resistance zones, and moving averages. Candlestick patterns can add even more strength to your setups. This confluence improves your odds.
Stick to essential levels like 38.2%, 50%, and 61.8%. Apply them only to recent, relevant price movements. This keeps your charts clean.
Stay on top of market news and events. Pair Fibonacci with leading indicators to get a more timely read on price action.
And don’t go in based on Fibonacci alone. Look for confirmations like trendline breaks, candlestick patterns, or signals from RSI or MACD. Multiple confirmations lead to more reliable trades.
Interpreting Fibonacci Levels
Fibonacci levels help traders identify potential buying or selling points, often relying on a self-fulfilling prophecy.
In other words, if enough traders use these levels, their stock orders may influence price movements in their favor.
While some traders may strictly buy or sell at Fibonacci levels, others may focus more on the overall market psychology rather than mathematical precision.
Additionally, Fibonacci levels are often combined with other technical indicators such as moving averages or the Relative Strength Index (RSI) to filter and enhance the quality of trading signals.
How to Calculate Fibonacci Retracements
Discovered by the Italian mathematician Leonardo Pisano Fibonacci, the Fibonacci sequence is a series where each number is the sum of the two preceding ones. This sequence starts with 0 and 1 and extends infinitely: 0, 1, 1, 2, 3, 5, 8, 13, 21…

This sequence has unique mathematical properties.
In 1753, the mathematician Robert Simson observed that as the sequence progresses, the ratio between two consecutive numbers tends towards 1.618…
This ratio, known as the “golden ratio,” exhibits unique mathematical properties.
Calculate its inverse (0.618). Calculate its square (0.382). Add these two results, and you get one (1). Take the golden ratio (1.618) and subtract its inverse (0.618), and you get one (1) again!
To calculate Fibonacci Retracements:
1. Identify the Initial Price Movement:
Determine whether the price movement is upward or downward. Calculate the amplitude, which is the difference between the starting and ending points of the price movement.
2. Apply Fibonacci Ratios:
Use predefined percentages derived from the Fibonacci sequence to calculate the retracement levels. Common retracement ratios include 23.6%, 38.2%, 50%, 61.8%, and 78.6%.
| Retracements Ratios | Extension Ratios |
|---|---|
| 23,6%, 38,2%, 50%, 61,8%, et 78,6% | 100%, 161,8%, 200% et 261,8% |
Calculation Formula:
Fibonacci Level = End Price of Initial Movement – (Amplitude × Fibonacci Ratio)
Example of an Upward Trend
Suppose a stock rises from €100 to €200. If it then declines following this initial rise, Fibonacci retracement levels can be used to identify potential support levels where the decline may halt, and traders might consider buying the stock.
These calculations help traders identify where the stock price might find support during a pullback, offering potential entry points for purchasing the stock based on Fibonacci retracement principles:
| Retracement level | Calculation | Target buy price |
|---|---|---|
| 23,6% | 200 – 100 x 23,6% | 176,40€ |
| 38,2% | 200 – 100 x 38,2% | 161,80€ |
| 50% | 200 – 100 x 50% | 150,00€ |
| 61,8% | 200 – 100 x 61,8% | 138,20€ |
Example of a Downward Trend
Imagine a stock falling from €100 to €80, a decrease of €20. If this stock begins to rebound after this initial drop, Fibonacci retracement levels can help identify potential resistance levels where the rise may stop, offering traders opportunities to sell the stock.
| Retracement Level | Calculation | Target sell price |
|---|---|---|
| 23,6% | 80 + 20 x 23,6% | 84,72€ |
| 38,2% | 80 +20 x 38,2% | 87,64€ |
| 50% | 80 +20 x 50% | 90,00€ |
| 61,8% | 80 +20 x 61,8% | 92,36€ |
In the best paper trading software, traders can select the initial price movement, and the software will automatically calculate and display Fibonacci retracement and extension levels. This helps traders quickly apply Fibonacci analysis to their strategies.
Fibonacci and Harmonic patterns
Harmonic patterns consist of sequences of bullish and bearish movements framed by Fibonacci retracement and extension levels.
This more complex approach does not suggest traders bet on the overall market trend; instead, it encourages betting on successive trend reversals as part of a fade trading strategy.
Fibonacci levels are particularly useful for identifying potential theoretical support and resistance levels. However, despite their frequent use in programming automated trading algorithms, the predictive power of this technical indicator has yet to be scientifically proven.

Maxime holds two master’s degrees from the SKEMA Business School and FFBC. As founder and editor-in-chief of NewTrading.fr, he writes daily about financial trading.


7 Popular Swing Trading Strategies with Practical Examples


The Most Popular Chart Patterns in 2026