Best Alternatives to StockCharts in 2026


Let me guess: You opened up StockCharts, tried to run a scan or customize a chart, and thought, “There has to be a more modern tool for this in 2026.“
You’re not wrong. For pure, classic technical analysis, StockCharts is a legend. Its library of market commentary is excellent, and its SharpCharts tool remains powerful for in-depth, traditional charting.

But the tools available to traders have evolved. Today’s leading platforms are built for a complete workflow, from idea generation to execution. They often include powerful features like automated backtesting, direct trading from charts, AI-driven insights, and community-sourced strategies, all designed to support a faster, more integrated process.
You’re likely looking for an upgrade to your toolkit, not just a replacement.
That’s exactly why I put this guide together. We won’t just list other charting sites. We’ll break down the platforms designed for the modern market, exploring the specific capabilities they offer—from all-in-one analytical suites to specialized AI scanners that can help refine your research process.
What are the Best StockCharts Alternatives?


FinViz
Finviz (short for Financial Visualizations) is a super strong platform that’s great for screening the market and getting new ideas, though it’s not really for deep-dive charting. It’s got this awesome, free stock screener with over 60 filters, covering descriptive, fundamental, and technical stuff. Plus, you get instant chart previews and those big, color-coded heat maps that give you a quick feel for what the market’s doing.

The platform also pulls together news, insider trading data, and analyst ratings, making it all super easy to access. While it mainly focuses on the US market and the free version has delayed data, Finviz is fantastic for quickly scanning thousands of stocks to find opportunities. If you want more advanced features like real-time data and backtesting, you can check out their paid Finviz Elite plan.
| Pros | Cons |
| Powerful free stock screener with 60+ filters for fundamentals, technicals, and descriptive data | Primarily focused on US markets |
| Instant chart previews by hovering over ticker symbols | Free version has data delays |
| Large, color-coded heat maps for quick market sentiment checks | Basic charting tools lacking depth for advanced technical analysis |
| Aggregate news, insider trading activity, and analyst ratings in one place | Ad-heavy interface on the free plan |
| Fast and efficient at scanning thousands of stocks without requiring an account | Advanced features like real time data, backtesting, and data export requires the paid FinViz Elite plan |
Why Choose Finviz Over StockCharts?
If you’re a trader who loves speed, simplicity, and getting new ideas, Finviz is better than StockCharts. StockCharts is good for learning with its ChartSchool and cool specialized charts, but it’s just too slow with its static charts and data.
Finviz has this super powerful, easy-to-use free stock screener with over 60 filters, instant chart previews, and heat maps that give you immediate insights into how the market’s feeling. This means even new traders can quickly find potential trades from a huge market view without a steep learning curve.
Plus, Finviz pulls together all the important trading info like news, insider trades, and analyst ratings into a visual, intuitive dashboard. This makes finding and checking out opportunities super easy for beginners. StockCharts does have some screening, but its syntax-based scanner can be tough for new users, and its delayed or paid-only real-time data just isn’t helpful for making quick decisions.
Finviz’s straightforward interface and fast filtering process give you a much more efficient starting point for market analysis, especially when you use it with a dedicated charting platform for deep technical dives.
Interactive Brokers
Interactive Brokers (IBKR) is a top-notch global brokerage. Seriously, it’s got excellent market access, keeps costs low, and offers some really advanced trading tools. Their main platform, IBKR Desktop, lets you jump into over 150 markets using 27 different currencies.
Clients get sweet deals with super low commissions, great margin rates, and a lot of fancy order types and algorithms to get trades done just right. Plus, IBKR boasts one of the largest inventories for short-selling available to retail traders.

Now, IBKR can be a bit tricky to learn, and its built-in charts seem to be a generic TradingView account, but IBKR nails it by hooking up seamlessly with awesome charting platforms like TradingView and ProRealTime.
This means traders can get IBKR’s world-class trade execution alongside much better charting features. So, if you’re an experienced, cost-conscious trader who really values institutional-level global access over a super simple, all-in-one platform, then IBKR is definitely the way to go.
| Pros | Cons |
| Unmatched access to 150+ global markets in 27 currencies | IBKR Desktop Interface is complex and intimidating for beginners |
| Industry-leading low commissions and margin lending rates | Native charting tools are dated and lack depth compared to modern platforms |
| Over 100 advanced order types and execution algorithms | Steep learning curve and less beginner-friendly than competitors |
| Extensive short-selling inventory for diverse trading strategies | Workflow can feel fragmented when using multiple platforms for charting and execution |
| Seamless integration with platforms like TradingView and ProRealTime | Focused more on execution rather than education or community features |
| Strong account security with mandatory two-factor authentication |
Why Choose Interactive Brokers Over StockCharts?
If you’re an active trader who needs super-fast execution, access to markets all over the world, and wants to save on costs, Interactive Brokers (IBKR) is definitely the way to go over StockCharts.
While StockCharts is awesome for learning about technical analysis and looking at charts after the market closes, it just doesn’t have the real-time data and direct order execution that serious traders need.
IBKR connects you with over 150 markets in 27 currencies, offering super low commissions and a range of fancy order types. It’s basically perfect for day traders, swing traders, and global investors who want professional-grade tools and reliable trading. Plus, it plays nice with platforms like TradingView and ProRealTime, so you can combine awesome charting and analysis with IBKR’s speedy, cheap execution, something StockCharts just can’t compete with.
Yeah, their IBKR Desktop interface can be a bit tricky to navigate, and the built-in charting is okay. But honestly, IBKR’s flexibility, low fees, and huge market reach make it a much more powerful and versatile choice for experienced traders who are all about real-time trading and spreading out their investments.
ProRealTime
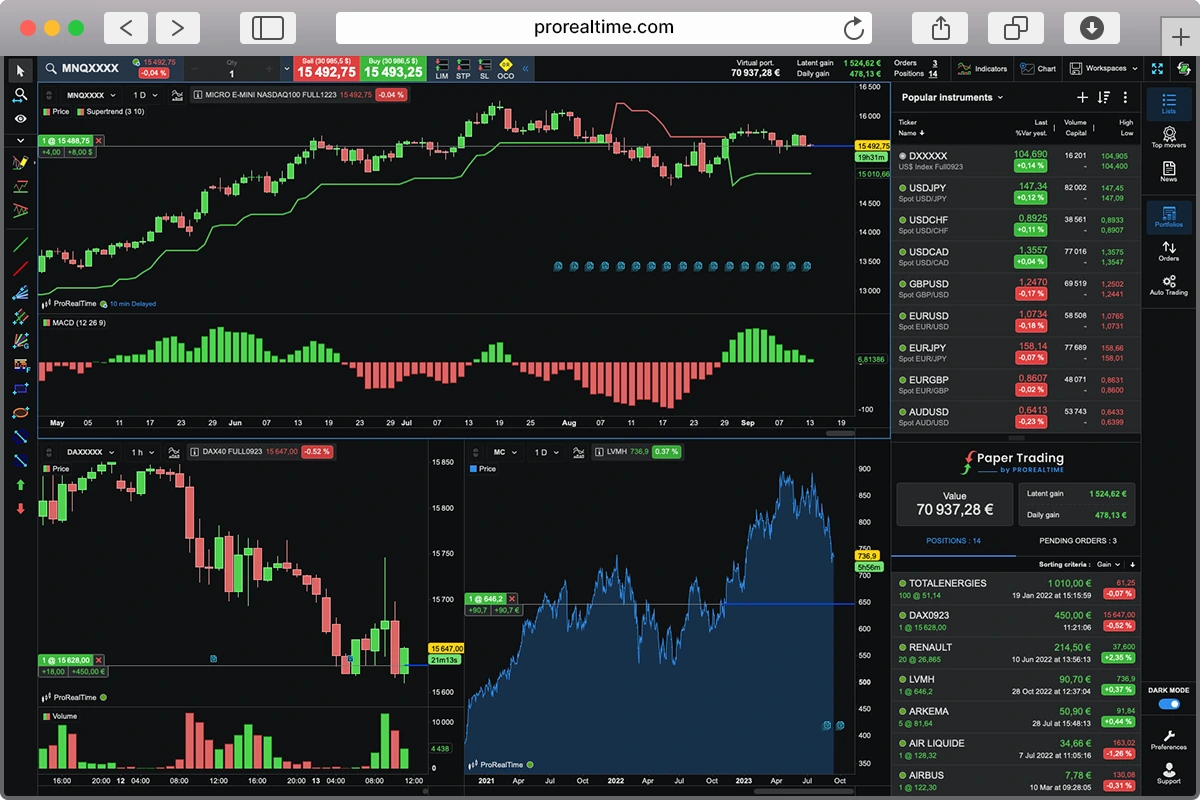
ProRealTime is a super powerful trading and analysis platform, perfect for serious traders who really care about automation and getting top-notch market data.
One of its coolest features is its server-side automated trading, which means your strategies keep running even when your computer’s off. You get super fast, tick-by-tick data straight from the exchanges, plus awesome charting with over 100 indicators, 40+ drawing tools, and unique chart types like Kagi and Renko.

Why Choose ProRealTime Over StockCharts?
It also has some really handy tools to help you make decisions, like the ProScreener scanner and ProRealTrend for automatic trendlines. ProRealTime works great with big-name brokers like Interactive Brokers, Saxo Bank, and IG, so your trades go through quickly and reliably.
Just a heads-up though: it takes some effort to learn, doesn’t have a ton of broker choices, and the pricing is more for “pros.” So, it’s probably a better fit for experienced traders than folks just starting out.
| Pros | Cons |
| Server-side automated trading for uninterrupted 24/7 strategy execution | Steep learning curve and complex interface for beginners |
| High quality, low-latency, tick by tick data direct from exchanges | Pricing model can be confusing, with costs applying if trade volume minimums aren’t met |
| Advanced charting with 100+ indicators, 40+ drawing tools, and multiple chart types | Limited broker integrations compared to more open platforms |
| Powerful, customizable market scanning tools like ProScreener and ProRealTrend | Smaller user community and fewer collaborative/social features than competitors |
| Deep integration with top-tier brokers for fast, reliable execution | Primarily targeted at experienced traders, making it less beginner-friendly |
| Free access available with sufficient monthly trading volume via partner brokers |
If you’re an experienced trader who needs real-time accuracy, automation, and pro-level execution, ProRealTime is a much better choice than StockCharts. StockCharts is great for learning and has some cool chart types, but it’s not ideal for active trading because its charts are mostly static or semi-interactive, and data is delayed unless you pay extra.
ProRealTime, on the other hand, gives you super-fast, tick-by-tick data straight from the exchanges. Plus, it supports automated trading that runs on their servers, so your strategies can keep going even if your computer’s off.
Its advanced charting tools, customizable scanners, and specialized chart types are way better for traders who demand speed, precision, and flexibility in fast-moving markets.
ProRealTime also has awesome integrations with top brokers like Interactive Brokers, Saxo Bank, and IG, letting you execute orders directly from the charts incredibly fast, something StockCharts doesn’t offer.
While ProRealTime does have a steeper learning curve and is more complex, it’s really built for traders who are beyond the basics and want to trade like a pro. This combo of automation, top-notch data, and execution capabilities makes ProRealTime a much more powerful, real-time trading platform, especially compared to StockCharts’ focus on education and end-of-day analysis.
TradingView
TradingView is basically the go-to platform for charting and social trading. It’s pretty much the gold standard for market analysis these days. There are over 100 million users worldwide, all using its interactive HTML5 charts that come packed with more than 100 built-in technical indicators and over 110 drawing tools. Plus, everything syncs up perfectly across your web, desktop, and mobile devices.

The community is super active, letting traders swap ideas, post their analyses, and even create their own custom indicators or strategies using Pine Script. You’ll find over 100,000 community-made tools available!
TradingView covers a huge range of global markets and even lets you trade directly through certain integrated brokers. And if you want to practice, features like Bar Replay are there for visual backtesting.
Sure, the free plan has its limits, and you’ll need to pay extra for official real-time exchange data. But honestly, TradingView’s awesome usability, flexibility, and collaborative vibe make it a top pick for both new and experienced traders.
| Pros | Cons |
| Best in class, fast, and fully interactive charts with 100+ indicators and 110+ drawing tools | Free plan is limited and include ads |
| Large, active trading community sharing ideas, analyses, and custom scripts | Official real time data from major exchanges requires paid add-ons |
| Cross platform access with seamless syncing between web, desktop, and mobile | Potential information overload and FOMO from constant community ideas |
| Bar Replay feature for visual backtesting and practice | Quality of community generated content can be inconsistent |
| Supports a wide range of global markets and integrates with select brokers for direct trading | Some features and advanced tools locked behind higher-tier subscriptions |
Why Choose TradingView Over StockCharts?
For traders who value speed, interactivity, real-time analysis, and a strong community, then TradingView is definitely a step up from StockCharts.
StockCharts can feel a bit sluggish with its static charts and slower data, but TradingView is super smooth with its fully interactive HTML5 charts, working great on web, desktop, and mobile.
You can zoom and pan instantly and customize pretty much everything. Plus, TradingView packs over 100 built-in indicators, more than 110 drawing tools, and its Pine Script lets you create or grab thousands of community-made strategies and indicators.
It’s a much more dynamic and hands-on experience for active traders compared to StockCharts’ slower, click-to-refresh approach.
What’s more, TradingView covers a ton of global markets, integrates with various brokers, and has this awesome social network where traders can swap ideas and sharpen their skills. You can publish your charts, learn from others, and fine-tune strategies with cool tools like Bar Replay.
It’s a much more engaging learning environment than StockCharts’ less dynamic educational stuff. Sure, real-time exchange data might cost extra, and the free plan has its limits, but TradingView’s speed, ease of use, and community vibe make it a really versatile and modern choice for traders looking for both analytical power and real-time execution.
TrendSpider
TrendSpider is a super smart trading platform that uses AI to make technical analysis way easier and more precise. It’s perfect for traders who want to make quick, data-backed decisions. Its best trick is automated technical analysis, where algorithms draw trendlines, spot chart patterns, and even plot Fibonacci levels with impressive accuracy, taking out all the guesswork.

You can also do no-code backtesting, play around in the AI Strategy Lab to test out strategies you describe in plain English, and even overlay higher-timeframe levels onto lower charts with multi-timeframe analysis (MTFA). Every plan comes with real-time data and customizable alerts that really help traders save time and stay on track.
Just a heads up, TrendSpider can be a bit pricey, there’s no free version, and it takes a little while to get the hang of it. So, it’s probably a better fit for intermediate to advanced traders, not so much for total beginners.
| Pros | Cons |
| Automated technical analysis with AI-drawn trendlines, patterns, and Fibonacci levels | High subscription cost compared to many competitors |
| No-code backtesting and AI Strategy Lab for easy strategy creation and testing | No free version; only 14-day paid trial is available |
| Multi-timeframe analysis to overlay higher timeframe data on lower charts | Very steep learning curve for traders unfamiliar with technical analysis concepts |
| Real-time data included in all plans | No direct manual trade execution from the platform |
| Highly customizable dynamic alerts that adjust with evolving trendlines | Can encourage over-reliance on automation for beginners who haven’t mastered manual analysis |
| Removes subjectivity from charting and speeds up analysis |
Why Choose TrendSpider Over StockCharts?
Tired of squinting at charts trying to figure out where the trendlines should go? That’s where TrendSpider leaves StockCharts in the dust. Instead of static charts that force you to do all the heavy lifting, TrendSpider’s AI automatically draws trendlines, highlights chart patterns, and plots Fibonacci retracements with pinpoint accuracy.
It’s like having a tireless charting assistant working behind the scenes, so you can spot setups faster and with more confidence. On top of that, its no-code backtesting and AI Strategy Lab let you build and tweak trading strategies in minutes, no coding, no guesswork, just pure trading efficiency.
What’s more, all TrendSpider plans come with real-time data, powerful multi-timeframe analysis (MTFA) so you can combine insights from different timeframes on one chart, and smart alerts that actually adjust to market changes.
StockCharts is great for learning, but it just doesn’t have these advanced automation features, strategy testing tools, or real-time responsiveness. So, if you’re ready to move past basic tools and really streamline your trading with modern tech, TrendSpider offers a more efficient, feature-packed, and up-to-date platform.
Which StockCharts Alternative Should You Choose?
Picking the best alternative depends entirely on your trading style and goals.
Newbie traders can get a lot out of combining StockCharts’ ChartSchool with a free ProRealTime Web account. That way, they get cool, interactive charts while learning the ropes.
If you need to quickly scan for stocks and brainstorm ideas, Finviz is awesome, especially if you pair it with a dedicated charting platform for deeper dives.
Day traders who are all about real-time action will find TradingView super effective, especially with its paid real-time data add-ons. And if you’re into automation, ProRealTime or TrendSpider will be your jam once you’ve got manual charting down. For global traders looking for good value, Interactive Brokers is tough to beat, as long as you’re okay with its steep learning curve.
The cool thing about today’s trading tech is how flexible it is. You can totally mix and match tools. Many traders employ a hybrid approach, combining a screener like Finviz, a powerful charting platform like ProRealTime, TradingView, or TrendSpider, and a broker like Interactive Brokers to execute trades.
The main thing is to be honest about what you need, whether that’s speed, education, automation, manual control, global reach, or a local focus, and then test out platforms that fit the bill.
Here’s a quick cheat sheet from our research to help you match your trader type to the right StockCharts alternative:
| Type of Trader | Recommended Platforms |
|---|---|
| Diligent Student | StockCharts, Free TradingView, or ProRealTime |
| Aspiring Day Trader | TradingView (Paid Plan), ProRealTime, & Interactive Brokers |
| Patient Swing Trader | FinViz (Free), TradingView, or ProRealTime |
| Global, Cost-Conscious Investor | Interactive Brokers + TradingView or ProRealTime |

Cedric is a seasoned investment management strategist with over a decade of experience, currently working at TTUTC. He holds dual prestigious designations as a Chartered Market Technician (CMT) and Chartered Financial Analyst (CFA).