How to Backtest a Trading Strategy, a Step-by-Step Guide


Think your trading strategy is ready for the market? Not so fast. Before you risk real money, you need to put it to the test.
That’s where backtesting comes in. By running your strategy through historical data, you can see how it might have performed in different market conditions, spot weaknesses, and fine-tune key factors like entry signals, stop losses, and position sizing.
But here’s the thing—backtesting isn’t foolproof. Some traders get lost in data. Others rush through it and end up with misleading results.
This guide walks you through a clear, step-by-step process—so you can learn to backtest your trading strategy properly and avoid the common mistakes that trip up traders.
Let’s get started.
Backtesting helps assess how a trading strategy would have performed in different market conditions, making it easier to refine and improve.
A strategy with clear, objective rules for entries, exits, stop losses, and risk management produces more reliable and actionable results.
Biases like overfitting and look-ahead bias can create misleading backtest results, making a strategy seem profitable when it’s not.
Optimization should focus on creating a strategy that adapts to real-world conditions rather than fine-tuning for the best historical performance.
Backtesting is an ongoing process that requires testing, refining, and validating with fresh data to ensure a strategy remains effective over time.
Step 0: Define Clear and Objective Rules
A solid backtest always starts with a well-defined strategy. If your rules are vague or inconsistent, your results will become meaningless.
To create a clear framework, break your strategy into five essential components:
- Setup Criteria – When is a trade even worth considering?
- Entry Rules – What confirms a trade execution?
- Stop-Loss – How do you manage risk on each trade?
- Take-Profit – When and how do you lock in profits?
- Trade Filters – How do you refine trade quality and avoid bad setups?
Let’s use this framework to define backtesting rules for a simple EMA trend-following strategy on SPY.
| Component | Question | Rule |
|---|---|---|
| Setup Criteria | Conditions that must exist before a trade is considered | SPY’s price must close above the 50 EMA on the 4-hour chart. Volume on the entry candle must be above the 50-period average to confirm momentum. |
| Entry Rules | What triggers the trade? | Enter 100 shares long when the price crosses and confirms above the 50 EMA Short 100 shares when it crosses below, following the same conditions. |
| Stop-Loss | How will you limit risk? | Set the stop-loss order to 3 points, controlling downside risk per trade. |
| Take-Profit | How do you lock in gains? | Set the take-profit order to 5 points, maintaining a 1.67:1 risk-reward ratio. |
| Trade Filters | Additional conditions to improve accuracy | The 200 EMA on the daily chart must confirm an uptrend (i.e., price above it). |
> Click here to build a similar table for backtesting your system
Step 1: Choose a Backtesting Platform with Reliable Data
Quality is non-negotiable. Flawed data leads to flawed results. Ensure your backtesting tool provides more than just basic price data (open, high, low, close)—you’ll also need volume, technical indicators, and, if relevant, bid-ask spreads or tick data for advanced strategies.
Most serious backtesting platforms are subscription-based, but many offer free demos or basic plans so you can explore their features before committing.
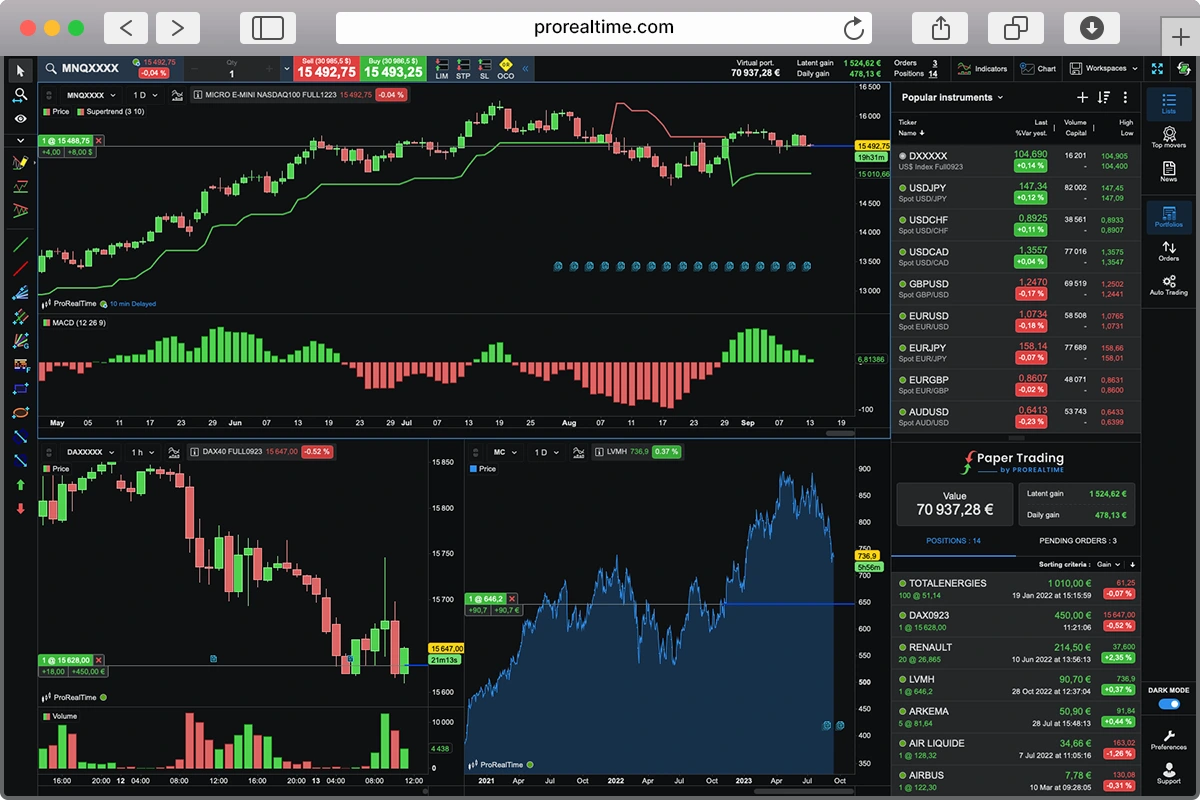
For the purpose of this guide, we’ll use ProRealTime, specifically ProBacktest—a powerful backtesting tool that lets you test strategies on historical data, tweak parameters, and analyze and compare performance with detailed metrics.

You can run your first backtests for free with ProRealTime’s demo account
Step 2: Set Up the Backtesting Environment
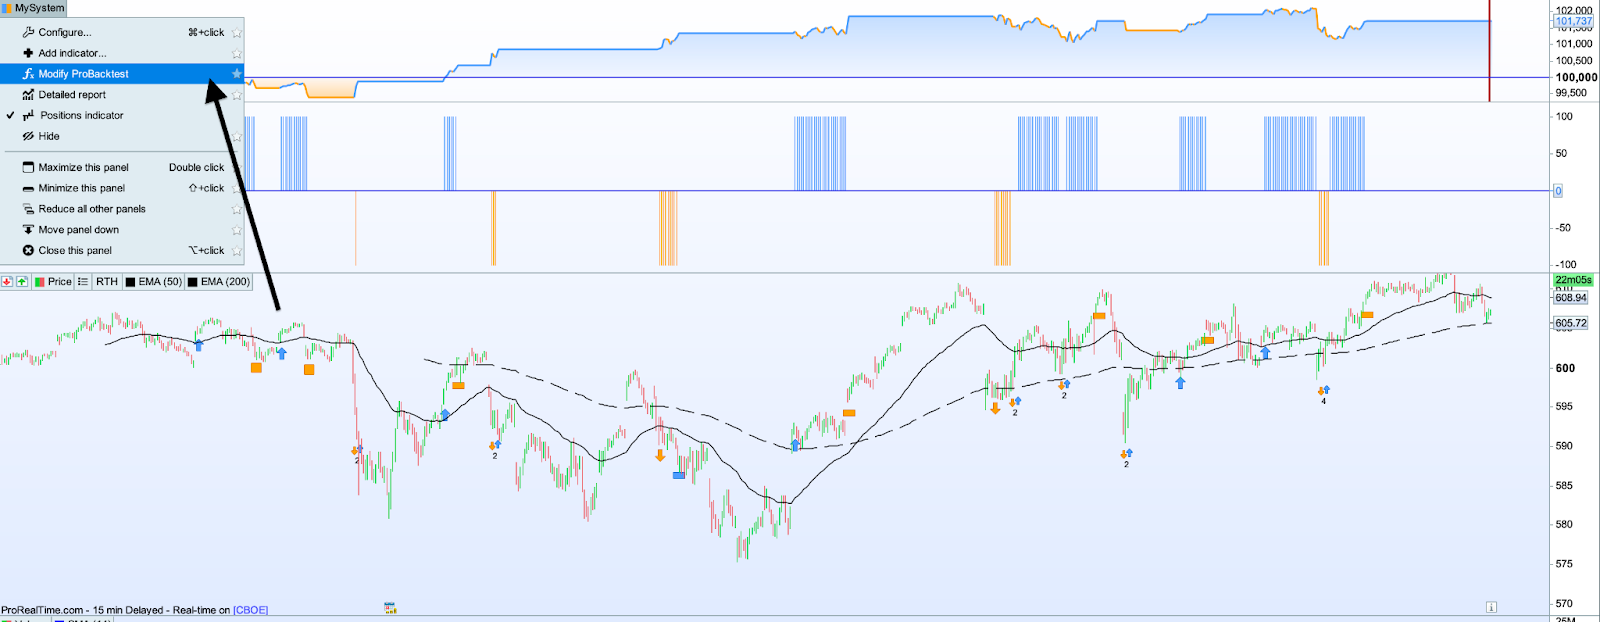
This is where you bring your trading strategy to life in a simulated, yet realistic setting. If you use ProRealTime, you can watch this video to learn how to set it up:
Make sure to use the panel displayed below to input trading costs like order fees and spreads. Simply adjust these parameters to reflect realistic trading conditions for your strategy.
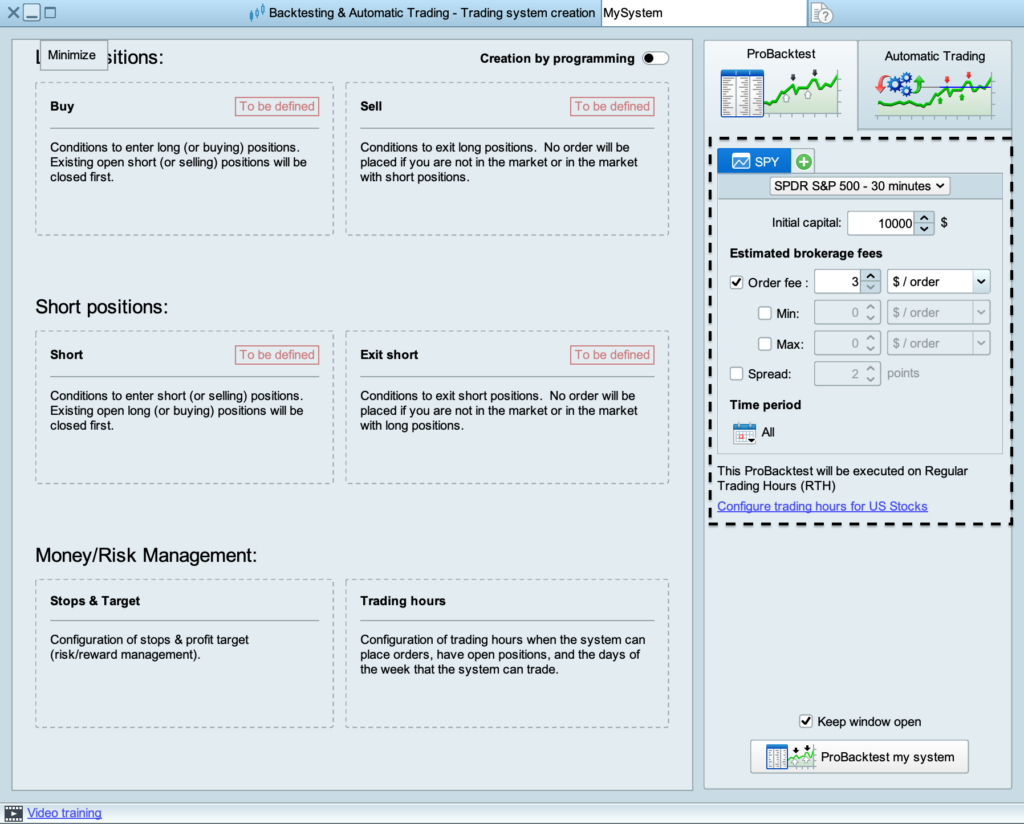
These costs can eat into profits, so they’re crucial for simulating the true performance of your strategy. Think of this setup as your strategy’s trial run in the wild. The more realistic you make it, the better prepared you’ll be when it’s time to trade live.
Once that’s done, define your risk management rules to align with your strategy. These include parameters for stop-losses, take-profit targets, and position sizing.
For example:
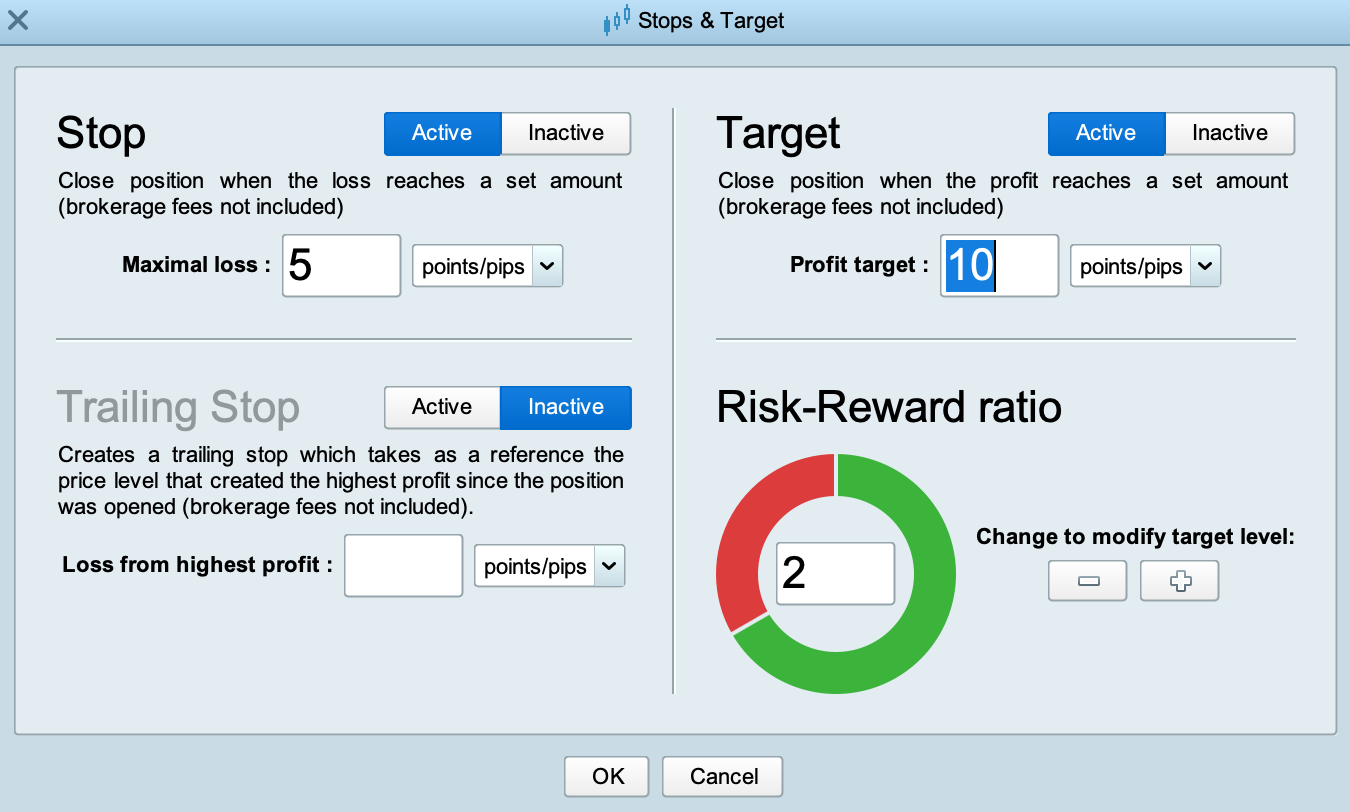
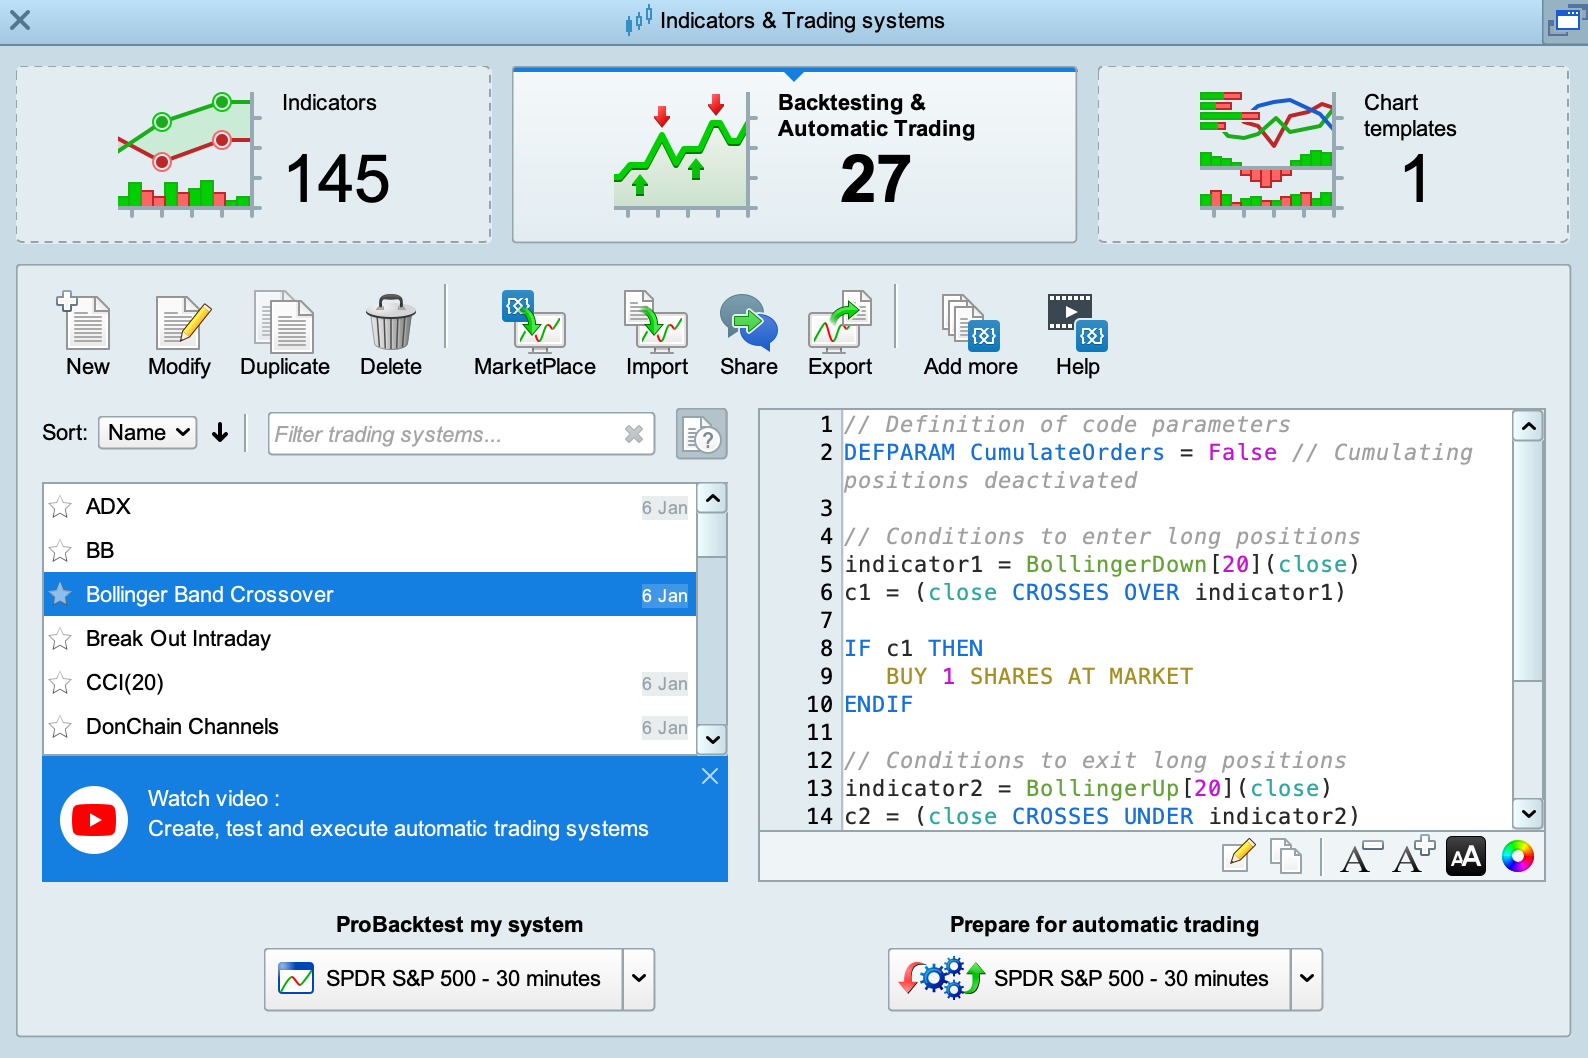
If you have some coding knowledge, ProRealTime offers tools to take your backtesting to the next level. By using custom scripts, you can refine your strategy and test more complex conditions. While no-code tools are available, leveraging programming can add an extra layer of customization and flexibility to your analysis.

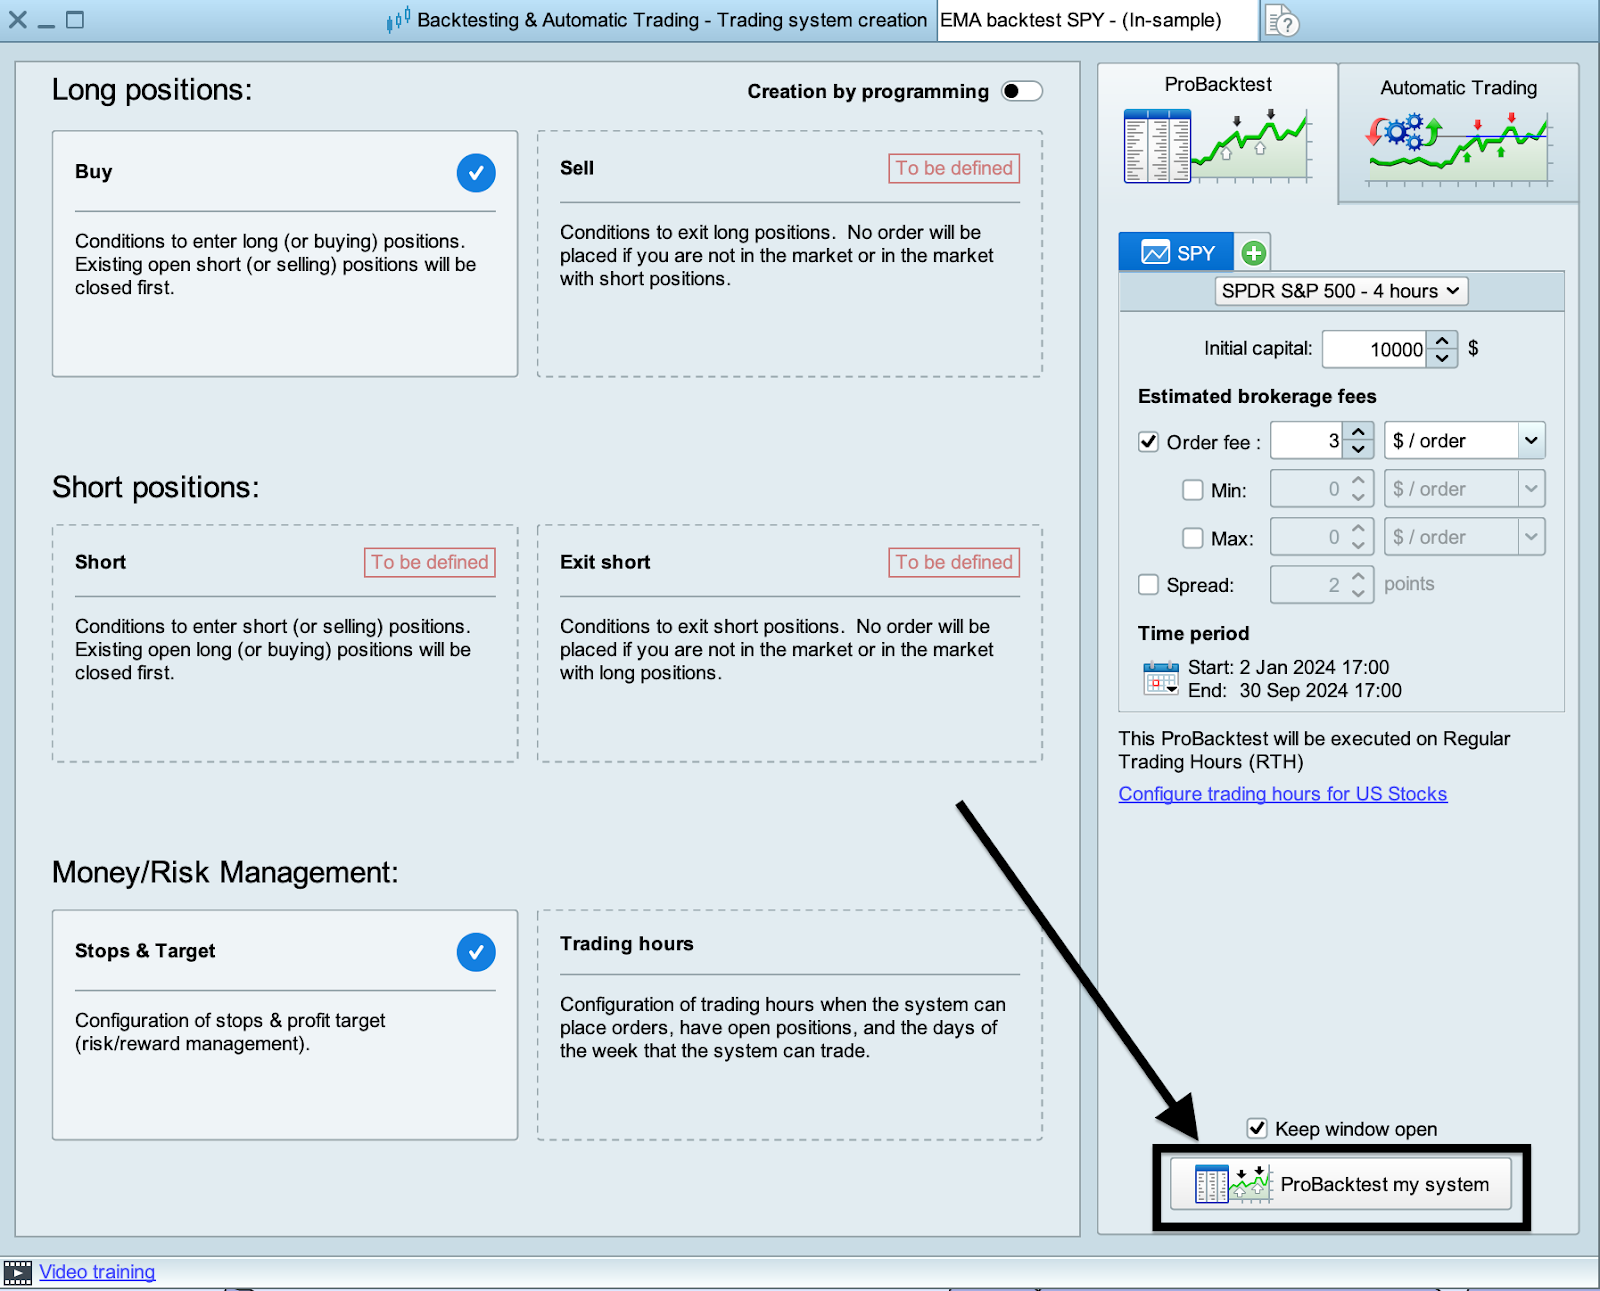
Step 3: Run the Backtest
Running the backtest is where the magic happens. You get to see how your strategy would have performed in the market based on historical data. Once your rules and parameters are set up, let the system do its work.
The backtest will simulate trades, executing entries and exits while calculating profits and losses based on your conditions. But this isn’t just about checking if the strategy is profitable—you also want to see how well it holds up in different market environments.
Make sure to let the backtest run through a wide enough dataset to cover various scenarios, from bullish trends to volatile shakeouts. Watching the results unfold is like peeling back the curtain on your strategy’s potential. It’s exciting, but it also provides critical feedback for refining your approach.
Step 4: Analyze the Results
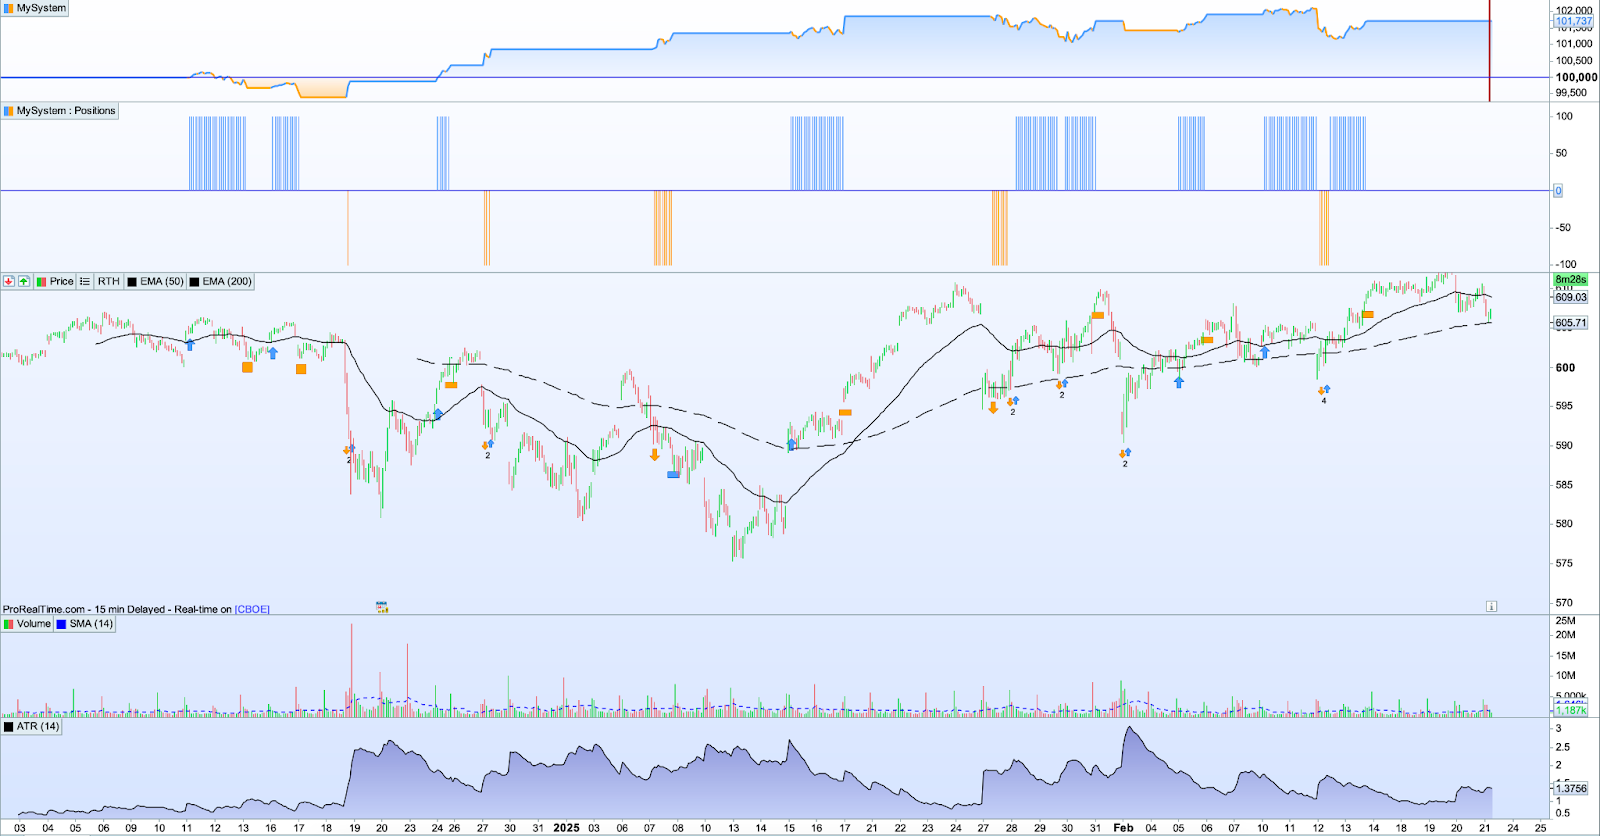
This is where you see if your strategy holds up. The backtest report provides a full breakdown of performance, highlighting profitability, risk, and trade statistics.
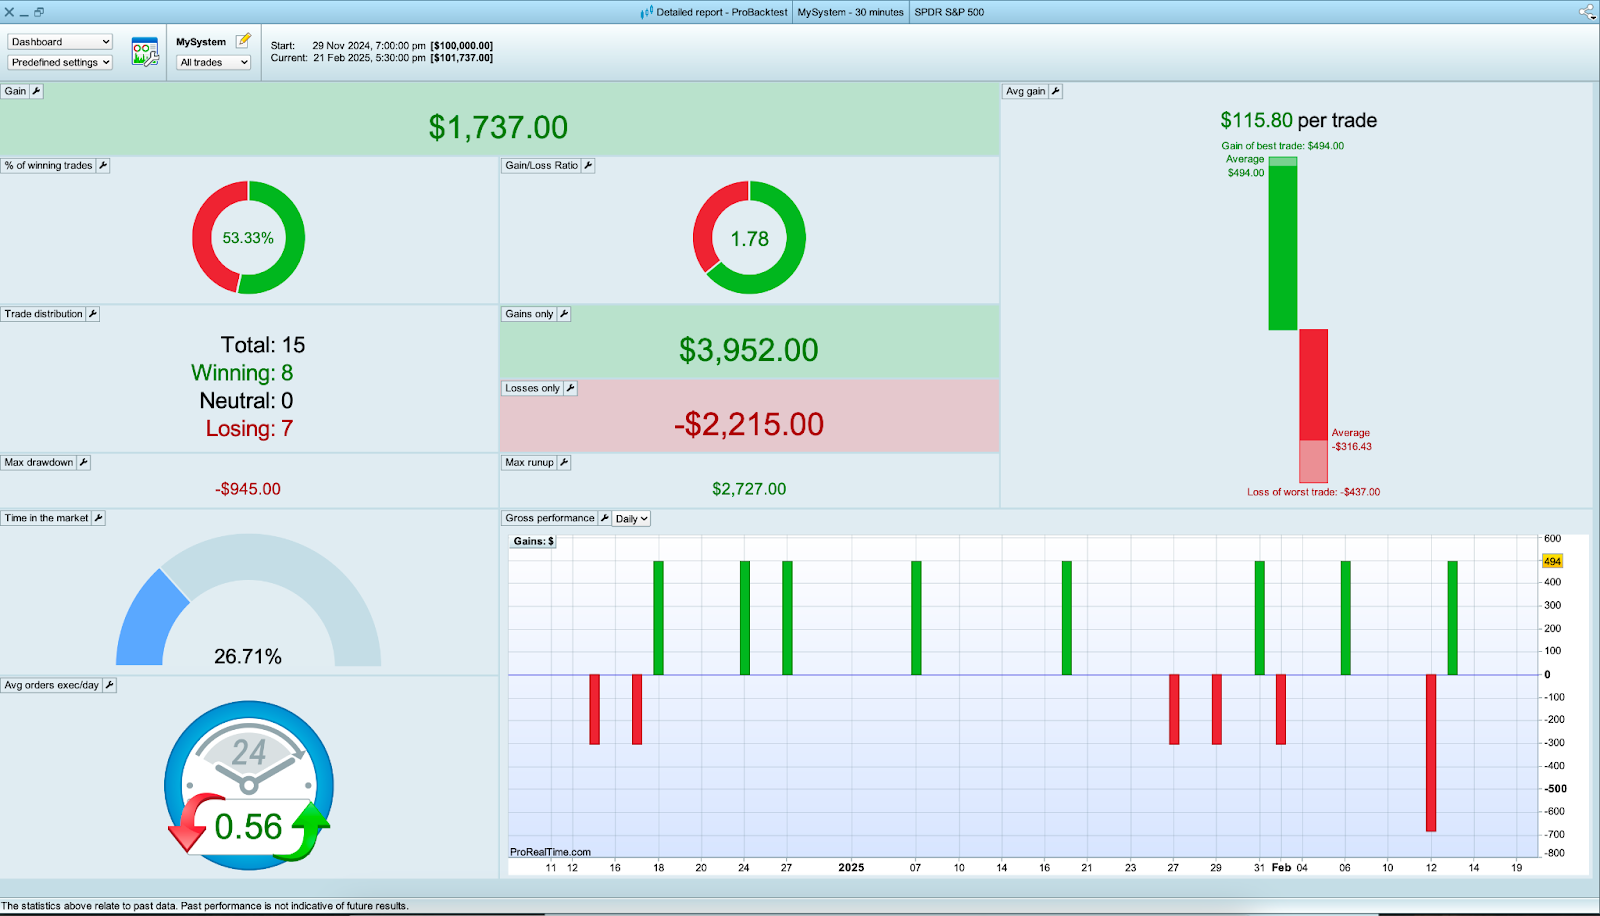
The strategy ended with a net profit of $1,737, averaging $115.80 per trade, with a 53.33% win rate (8 out of 15 trades profitable) and a 1.78 gain/loss ratio, meaning winners were larger than losers.
Total gains reached $3,952, while total losses added up to $2,215. The best trade gained $494, while the worst loss was -$437, contributing significantly to the -$945 max drawdown.
The strategy maintained moderate activity, with 0.56 trades per day, and was active 26.71% of the time, suggesting relatively short-term positions. The largest single loss of -$437 played a key role in the drawdown, which indicates that refining stop-loss placement or testing a trailing stop may help in reducing downside risk.
Although the system is profitable, further refinements could improve consistency. Adjusting entry confirmations might help reduce unnecessary losses, while tweaking take-profit placement could allow winners to run longer.
Testing these variations in ProBacktest could help strengthen the strategy’s resilience and improve long-term performance.
Step 5: Optimize your Strategy
A strong backtest is just the starting point. Optimization helps refine a strategy, but the key is making adjustments that improve real-world performance—not just past results.
The biggest risk in optimization is overfitting, where a strategy performs well on historical data but fails in live markets. This happens when settings are fine-tuned too precisely to past price action. To avoid this, focus on robust changes that hold up across different market conditions rather than just optimizing for the best backtest results.
Rather than locking in a single set of parameters, test a range of values to see how flexible the strategy is. If your strategy relies on a 50 EMA, try running it with 40, 45, 55, or 60 EMA and observe the impact. If a small tweak drastically changes performance, the strategy may be too rigid. The same applies to stop-loss and take-profit levels—small adjustments should improve efficiency, not break the system.
A strategy that only works in trending markets won’t hold up when conditions shift. Test it in both trending and ranging environments to ensure it adapts well. The goal isn’t to create something that wins every time—it’s to build a system that remains consistent and resilient across different market phases.
One backtest is never enough. Refining entry conditions, testing alternative EMA settings, and adjusting risk management rules will help you see what actually works. Instead of chasing the highest profit number, focus on reducing drawdowns and improving stability. That’s what separates a strategy that survives live trading from one that just looks good on paper.
Step 6: Validate the Results
Validating your backtest results is the ultimate reality check. It determines whether your strategy can withstand the unpredictability of live markets.
The most important step is out-of-sample testing—running your strategy on fresh data that wasn’t used in the initial backtest. This helps confirm whether the strategy is genuinely effective or if it was just overfitted to historical data. If performance holds up in unseen market conditions, that’s a strong sign of robustness.
For a more dynamic validation, walk-forward testing takes this a step further. Instead of optimizing your strategy once and applying it to the entire dataset, you repeatedly optimize and test it across multiple rolling time periods. This simulates how the strategy would adapt to changing market conditions, reducing the risk of overfitting.
Here’s an example of how different validation methods can drastically impact results:
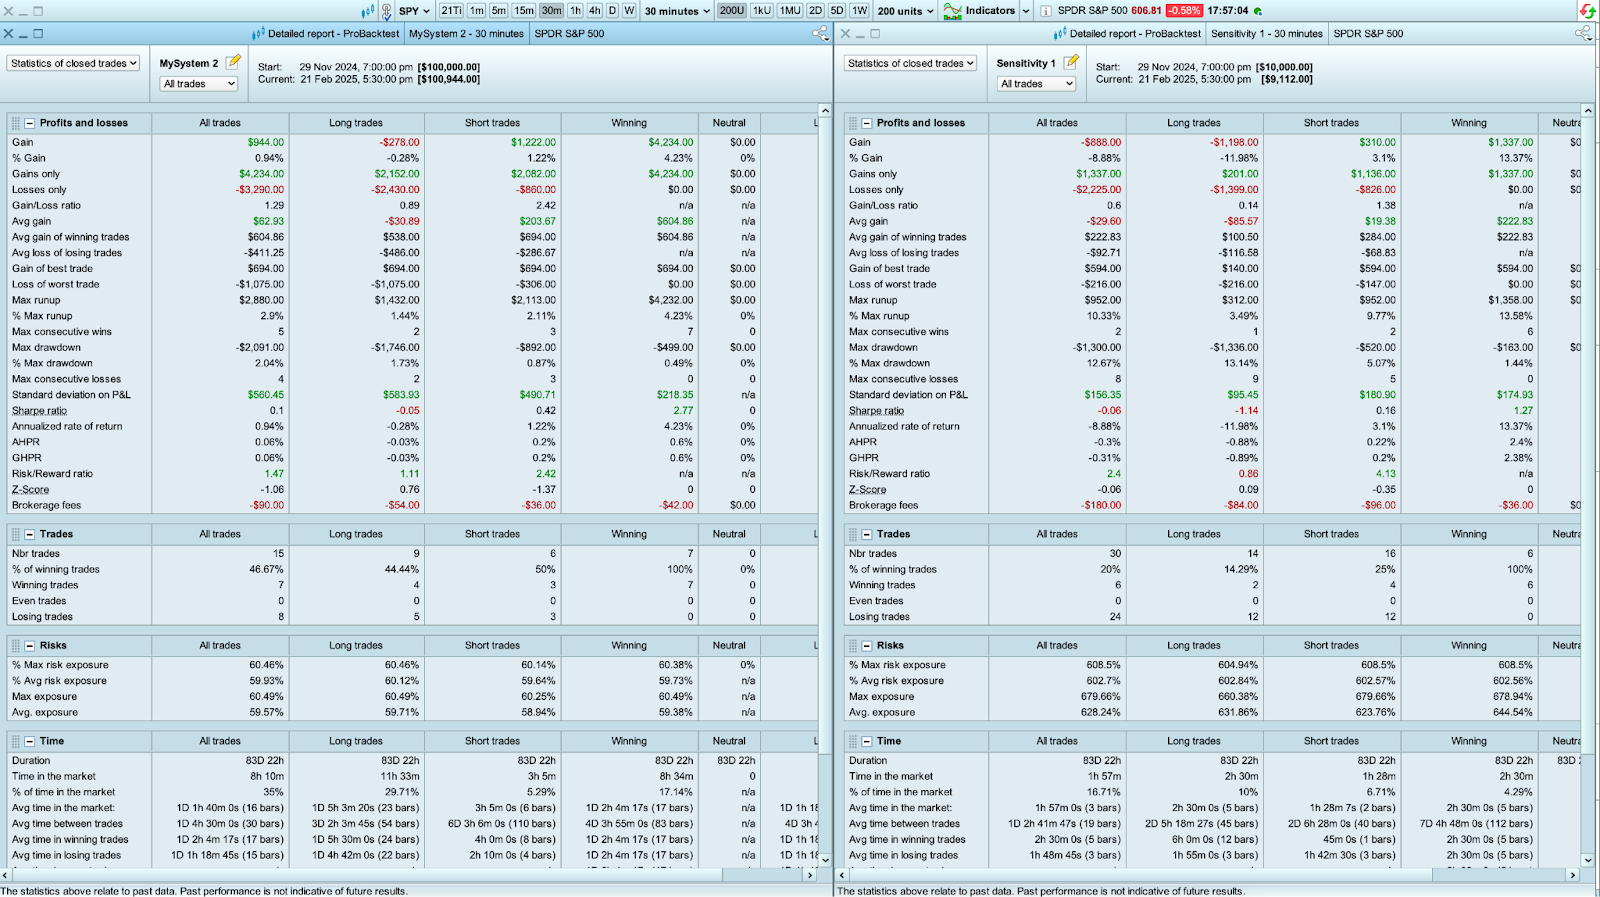
On the left, the trading systems performs well under certain conditions. But on the right, using a different validation method, performance drops significantly.
This demonstrates why testing beyond a single backtest is so important—what looks great in one dataset might fail in another. If your strategy performs well in both in-sample and out-of-sample tests and remains consistent across different market phases, it has a much higher chance of succeeding in live trading.
Step 7: Document your findings
ProRealTime automatically logs backtests, so you don’t have to manually track every metric.
This makes it easy to revisit past results, tweak strategies, and compare performance over time. But having data stored isn’t enough—you need to extract useful insights that guide your next decisions.
Instead of just looking at final numbers, keep a structured record of observations that will help refine your strategy later. Here’s what to track:
- Performance trends – Did results improve or decline over time? Were there specific conditions where the strategy performed significantly better or worse?
- Strengths – What aspects of the strategy consistently worked? (e.g., strong entries, high risk-reward trades, trend-following success).
- Weaknesses – What patterns led to losses? Were false signals or premature exits a recurring issue?
- Optimization History – What adjustments have been tested so far, and how did they impact results?
- Next Steps – What should be explored in future tests? Are there specific parameters that need further validation?
A well-documented strategy isn’t just for reference—it’s a tool for continuous improvement. The goal isn’t just to track results but to build a structured approach to refining your trading system over time.
Step 8: Iterate and Refine
The final step is where the real progress happens. Think of it as an ongoing dialogue with your backtesting results, using the feedback to identify areas for improvement.
Focus on pinpointing what worked, what didn’t and why.
- Isolate a flaw – Is the strategy losing too often in certain market conditions? Are drawdowns too large?
- Test a targeted change – Adjust one variable (e.g., stop-loss size, entry confirmation) and re-run the backtest.
- Measure impact – Did the adjustment improve performance, or did it introduce new risks?
- Refine and repeat – Keep what works, discard what doesn’t, and log everything for future reference.
Make thoughtful adjustments, tweaking parameters, fine-tuning rules, or incorporating insights from performance metrics. After each revision, re-test the strategy to ensure the changes bring consistent, reliable results across various datasets and market conditions.
It’s not about achieving reliable results across various datasets and market conditions or aiming for perfection but building an adaptable strategy you can trust in live trading.
The key is persistence and a willingness to refine until your strategy is not only profitable but also resilient.
Common Biases in Backtesting (And How to Avoid Them)
Backtesting mistakes can make a strategy look perfect in hindsight—but fail in live markets. The reason? Hidden biases that distort results. Here are the biggest ones to avoid.
- Overfitting happens when a strategy is too precisely tailored to past data. It looks flawless in a backtest, but the moment market conditions shift, it falls apart. If tweaking a parameter dramatically changes results, that’s a red flag. Keep your system simple, and always validate it on fresh, out-of-sample data.
- Look-ahead bias sneaks in when your strategy “sees” data it wouldn’t have known in real time. A common mistake is using future price action for entry signals without realizing it. The fix? Make sure your backtesting software processes data sequentially—just like real markets do.
- Survivorship bias makes a strategy seem better than it really is by ignoring stocks that failed. If your dataset only includes today’s successful stocks, you’re missing all the companies that were delisted. The solution? Use historical data that includes delisted stocks to get an accurate performance picture.
- Data snooping bias happens when you test dozens of variations and cherry-pick the one that performed best. The problem? That “winning” strategy might just be lucky. To avoid this, test across different timeframes and market conditions, and always confirm results with out-of-sample testing.
- Market evolution bias leads traders to believe that what worked years ago will keep working. Markets change—liquidity shifts, volatility cycles, and new technologies emerge. A system that thrived five years ago might be useless today. The best approach? Regularly revalidate your strategy with fresh data to ensure it still holds up.
Backtesting should reveal a strategy’s weaknesses, not just confirm its strengths. If your system only works under perfect conditions, it’s not ready for live trading. Identifying and correcting these biases is what separates a robust, adaptable strategy from one that’s doomed to fail.
FAQ
Why do strategies fail in live trading?
A strategy that performs well in backtests often struggles in live markets due to overfitting, look-ahead bias, or ignoring real trading costs like slippage and spreads. Market conditions also evolve, so past performance doesn’t guarantee future success. Backtesting should be used to better understand market behavior, not to chase a “perfect” system.
How much historical data should I backtest?
For day trading, 3–6 months of intraday data (1-minute or tick charts) provides enough setups to analyze. Swing traders need 3–5 years to capture different market conditions. Long-term traders should aim for at least 10 years to account for multiple market cycles. The goal isn’t just collecting data but testing across trends, volatility shifts, and structural market changes.
How do I know If my strategy is over-optimized?
If small parameter changes drastically impact results, the strategy is likely overfitted. Excessive filters and a near-perfect backtest performance are also red flags. A good system should work reliably within the market conditions it was designed for—but if it only succeeds in a narrow historical window, that’s a warning sign.
Manual vs. automatic backtesting – Which one should I use?
Manual backtesting forces traders to go step by step through historical data, improving market understanding and pattern recognition. Automatic backtesting runs strategies instantly, making it faster for testing ideas at scale. Manual testing is ideal for learning, while automation helps refine and validate strategies efficiently. Combining both provides deeper insights.
Is backtesting even worth it?
Backtesting doesn’t guarantee profits, but it helps separate skill from luck. It shows whether a strategy holds up over time, improves intuition, and provides insights into how it reacts to different market conditions. Some strategies work well in specific environments but break down in others. Testing across volatility spikes, trends, and ranging markets helps determine if a system is reliable or needs adjustment. While it won’t predict the future, backtesting provides a structured way to refine strategies and make more grounded decisions.

Cedric is a seasoned investment management strategist with over a decade of experience, currently working at TTUTC. He holds dual prestigious designations as a Chartered Market Technician (CMT) and Chartered Financial Analyst (CFA).


7 Popular Swing Trading Strategies with Practical Examples


The Most Popular Chart Patterns in 2026
