Learn to trade with method, guided by the educational signals of a trading veteran.
These signals are neither investment advice nor a recommendation to buy or sell, but an educational exercise to practise on a simulator. Real trading requires understanding complex financial products and bearing high risks, including rapid losses exceeding deposits. Past performance is not a guide to future results.
SELLFuture Dow JonesLive
Published at 19:48 (Paris time)
October 16, 2026
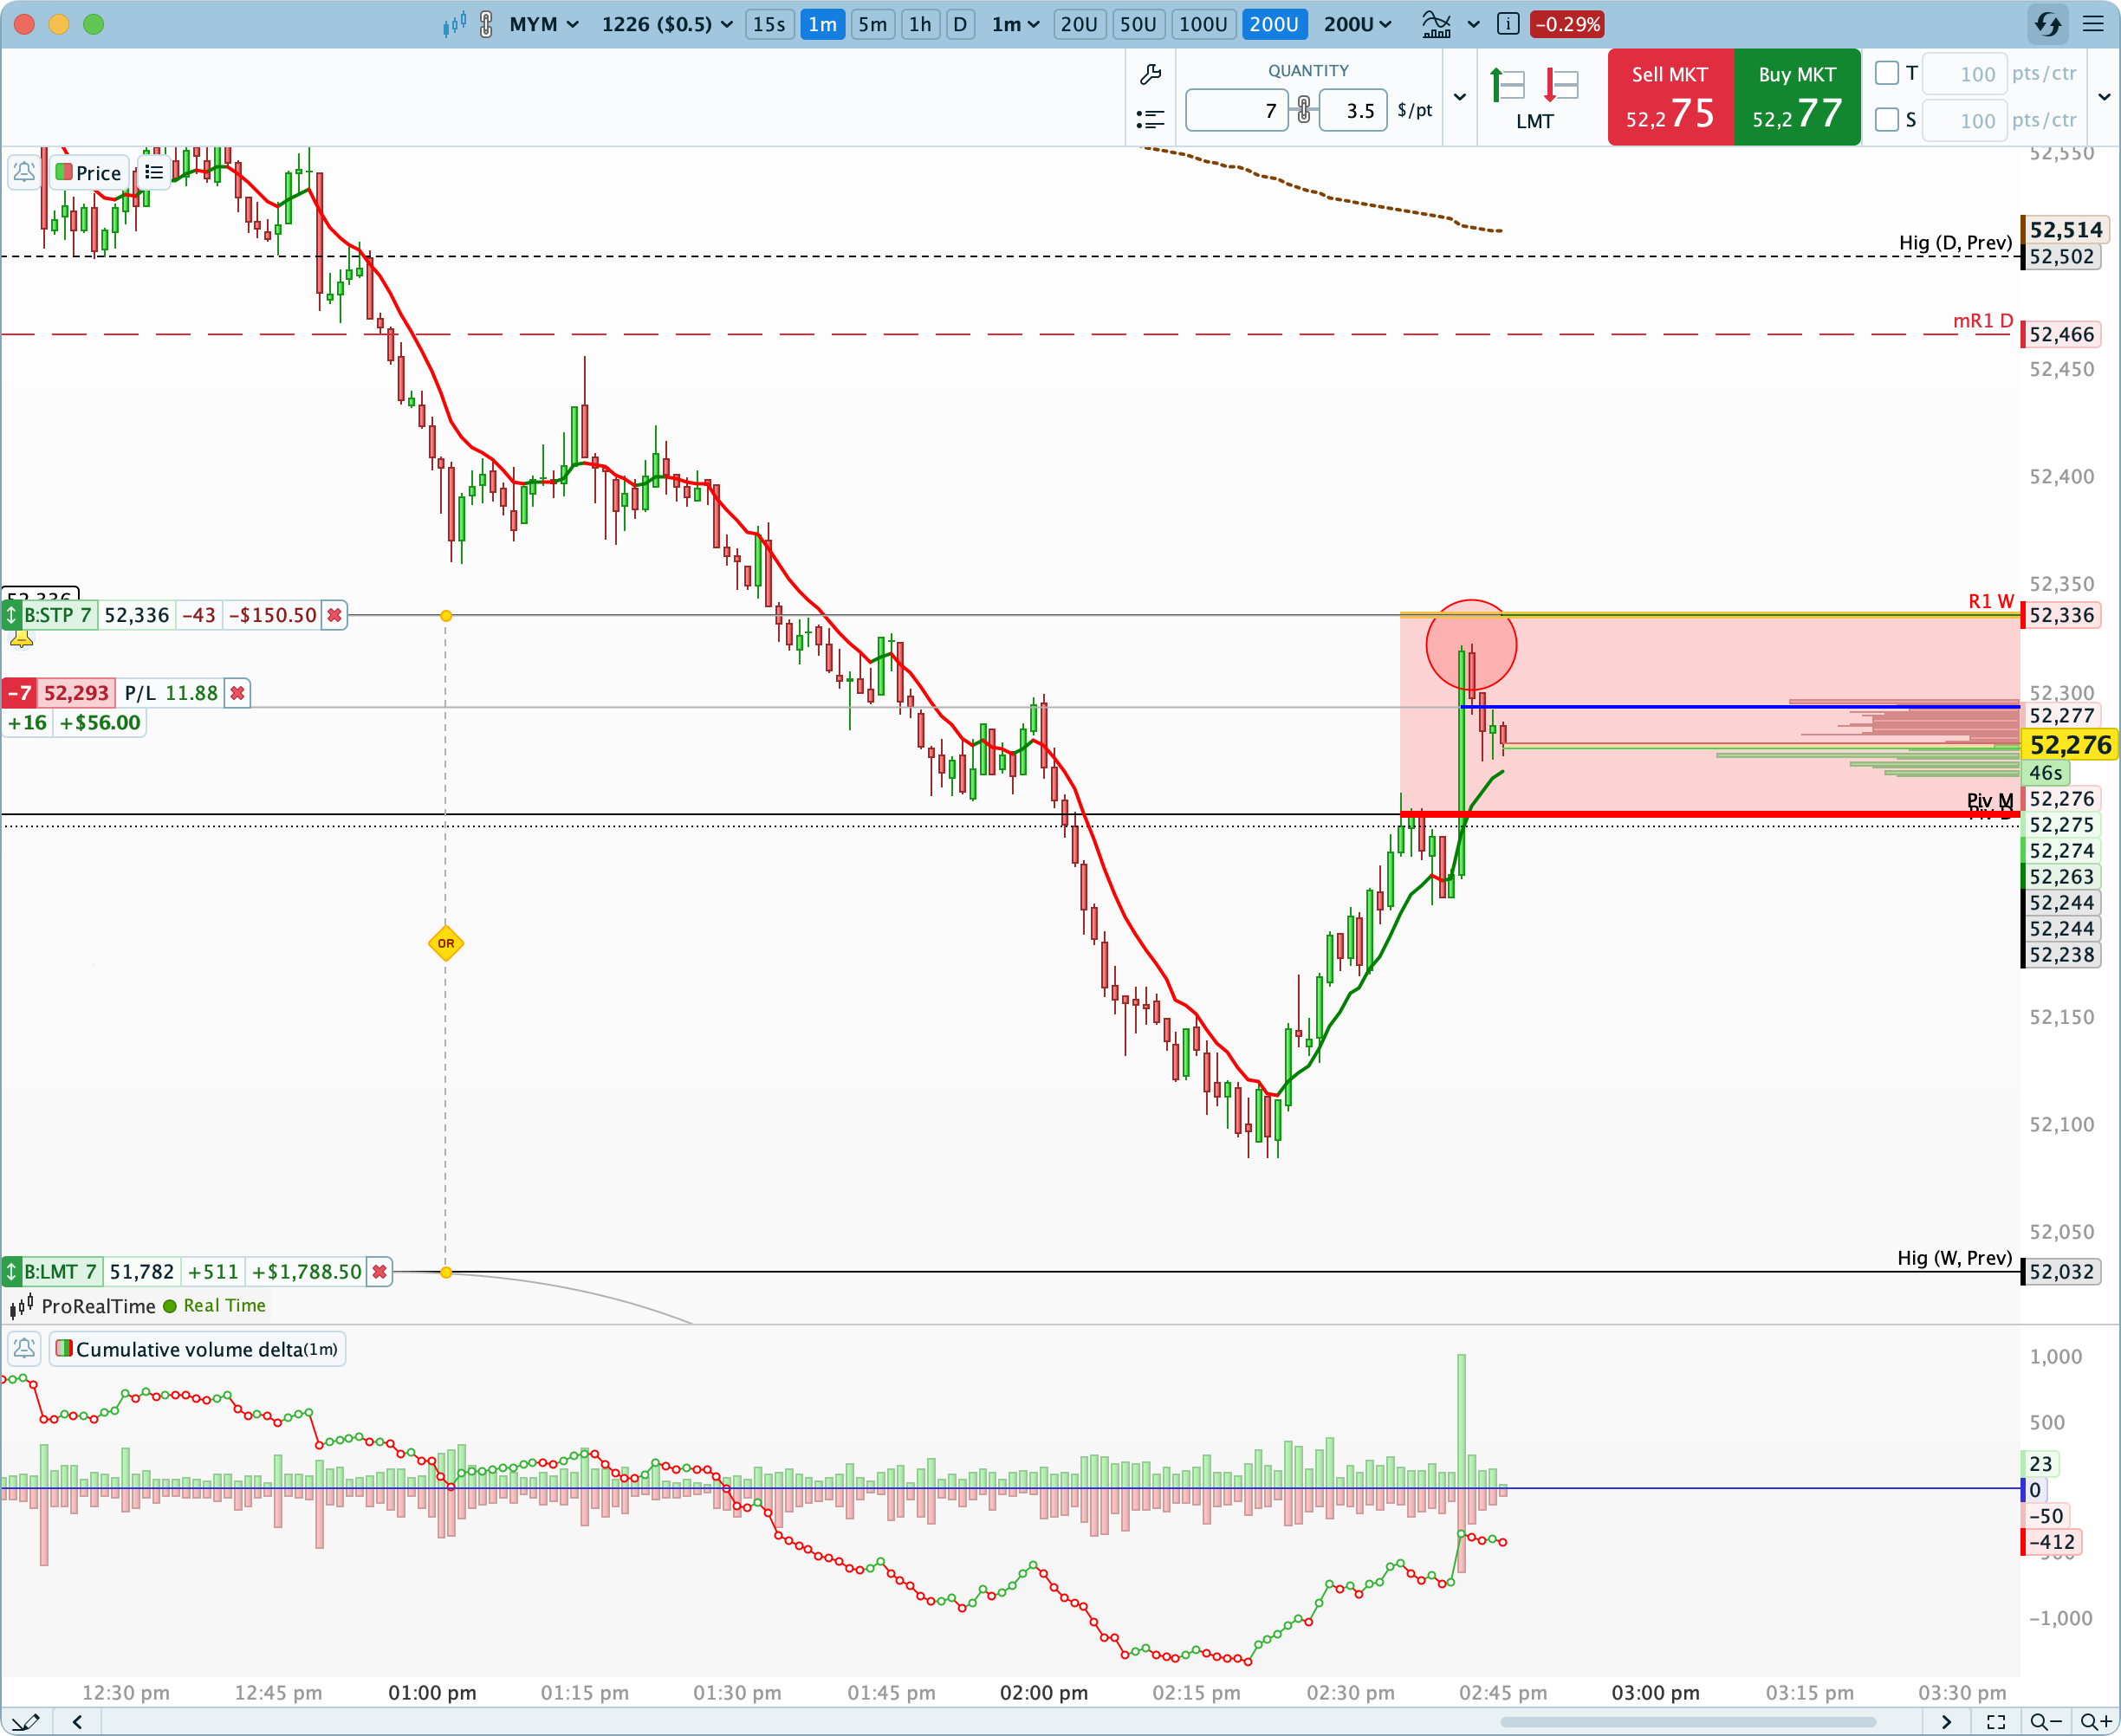
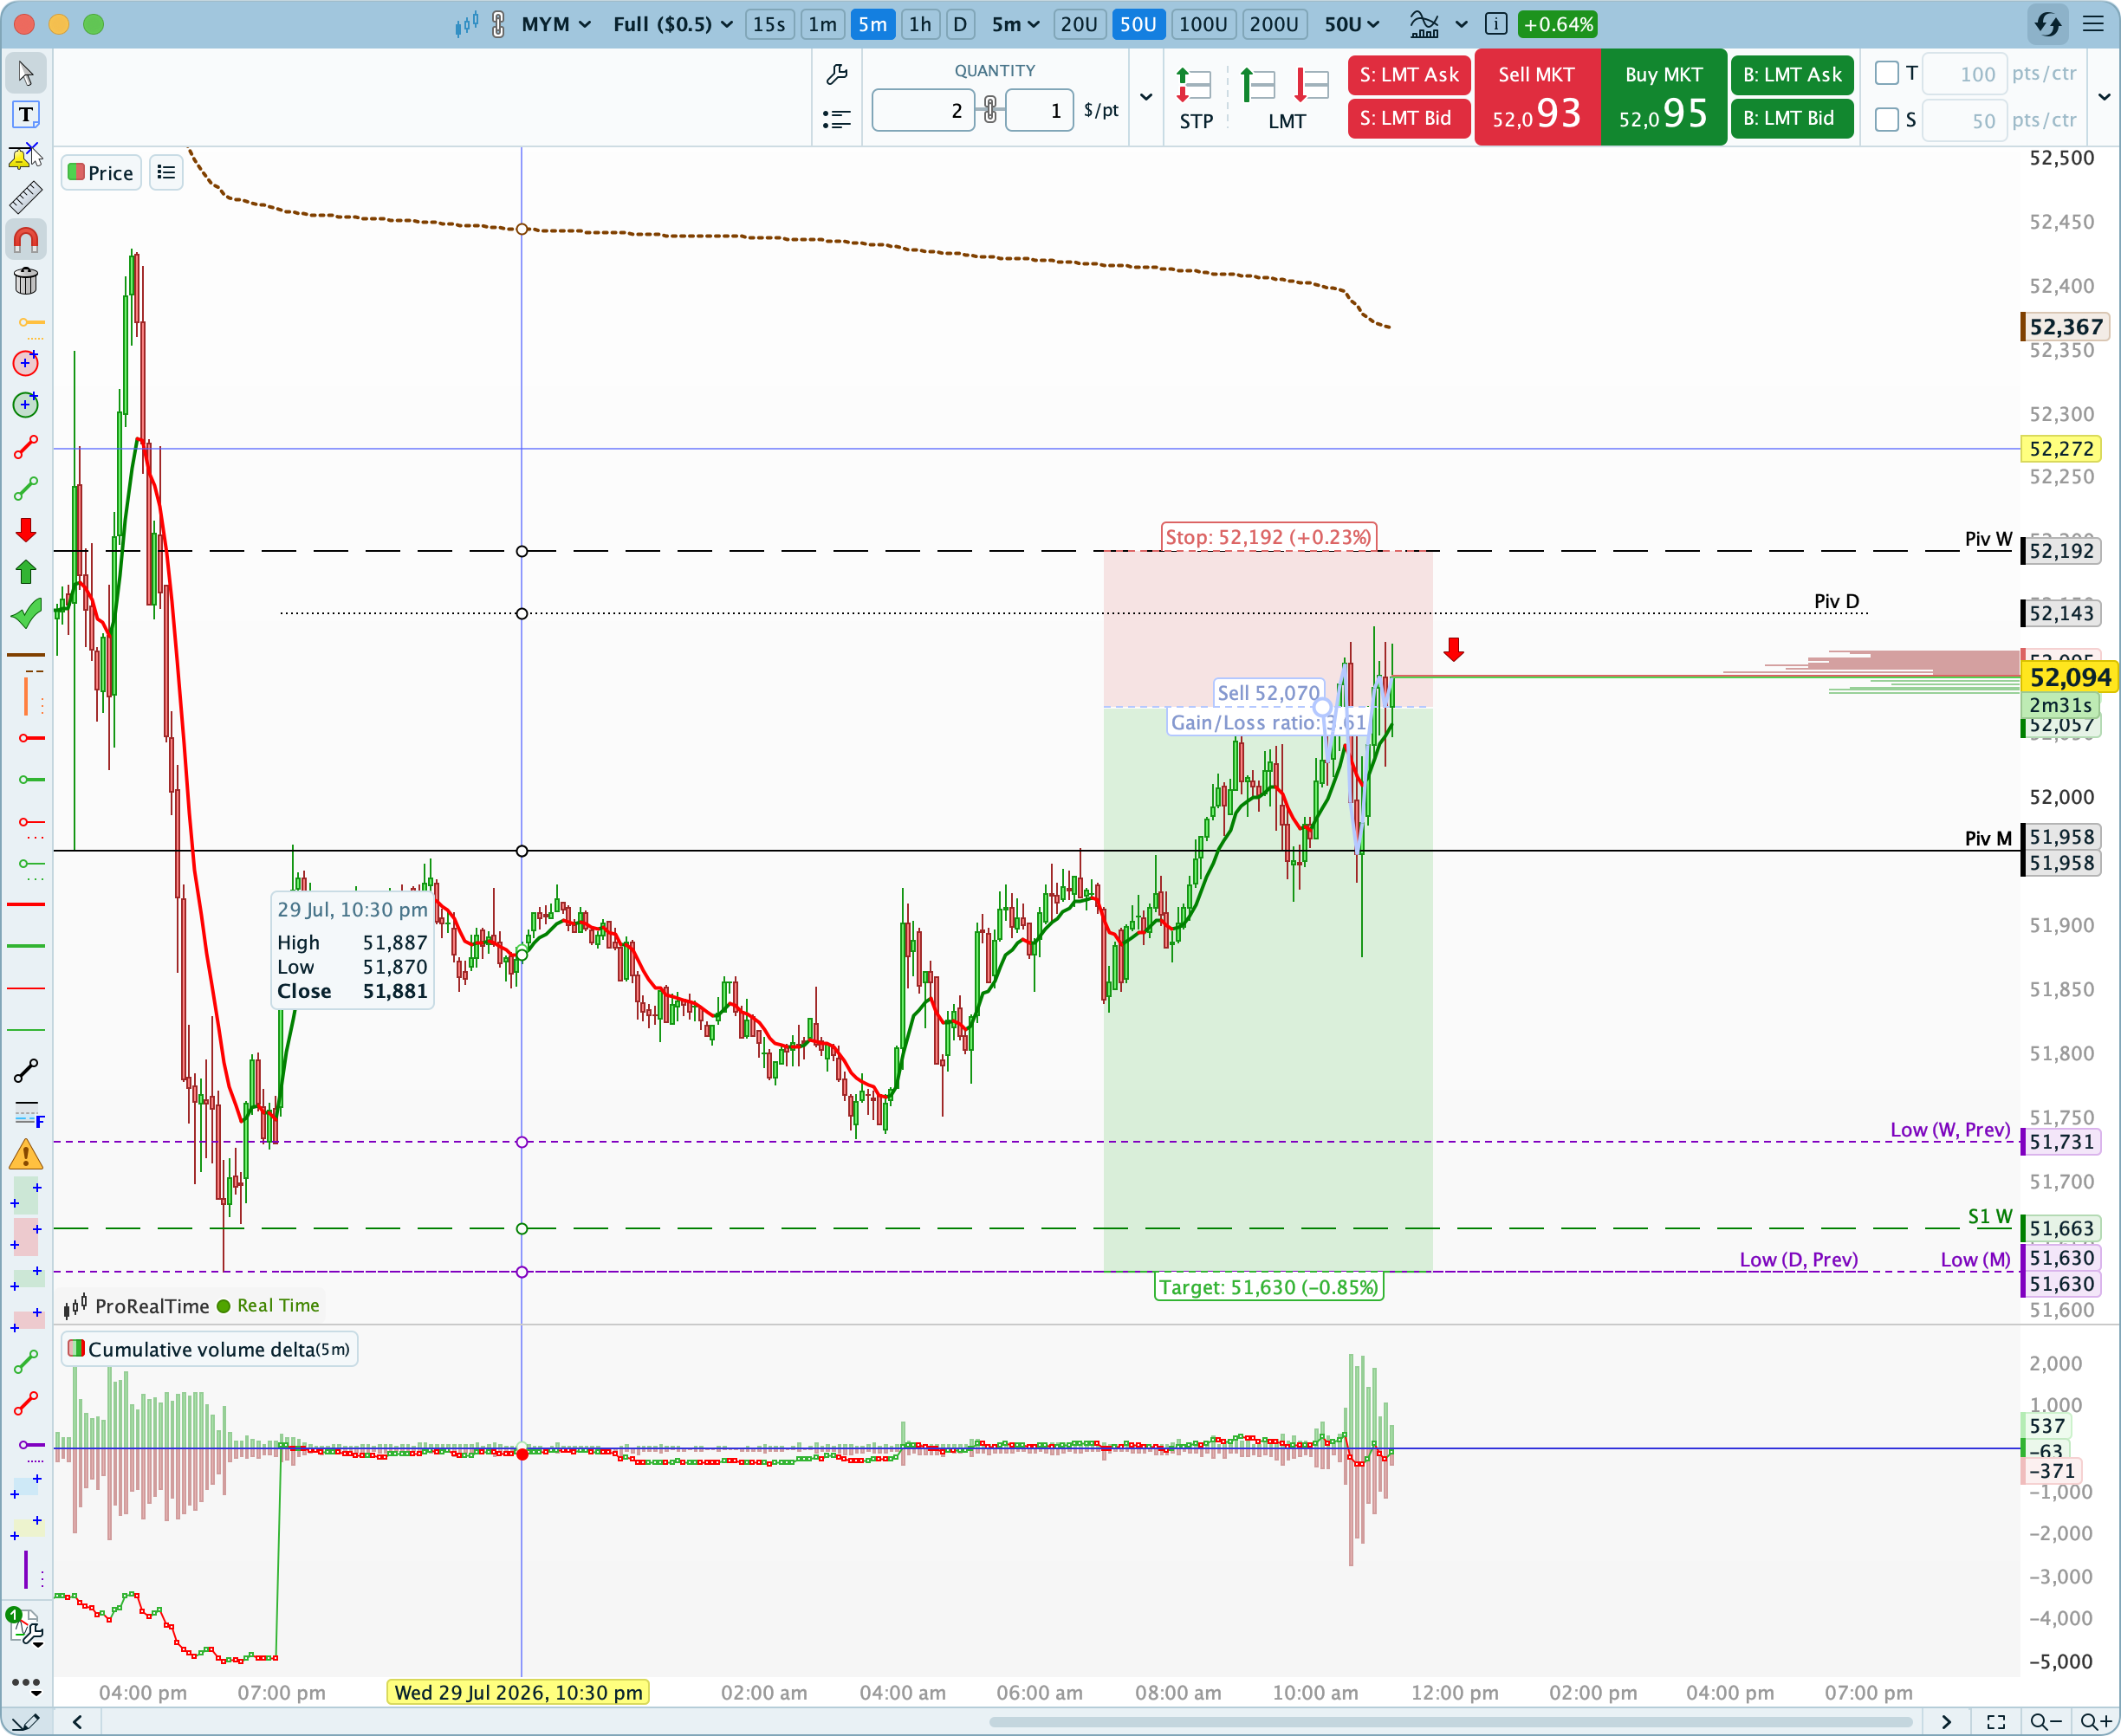
Entry52293
Stop Loss52336
Take Profit51782
Risk/Reward ratio11.88
Maxime's read
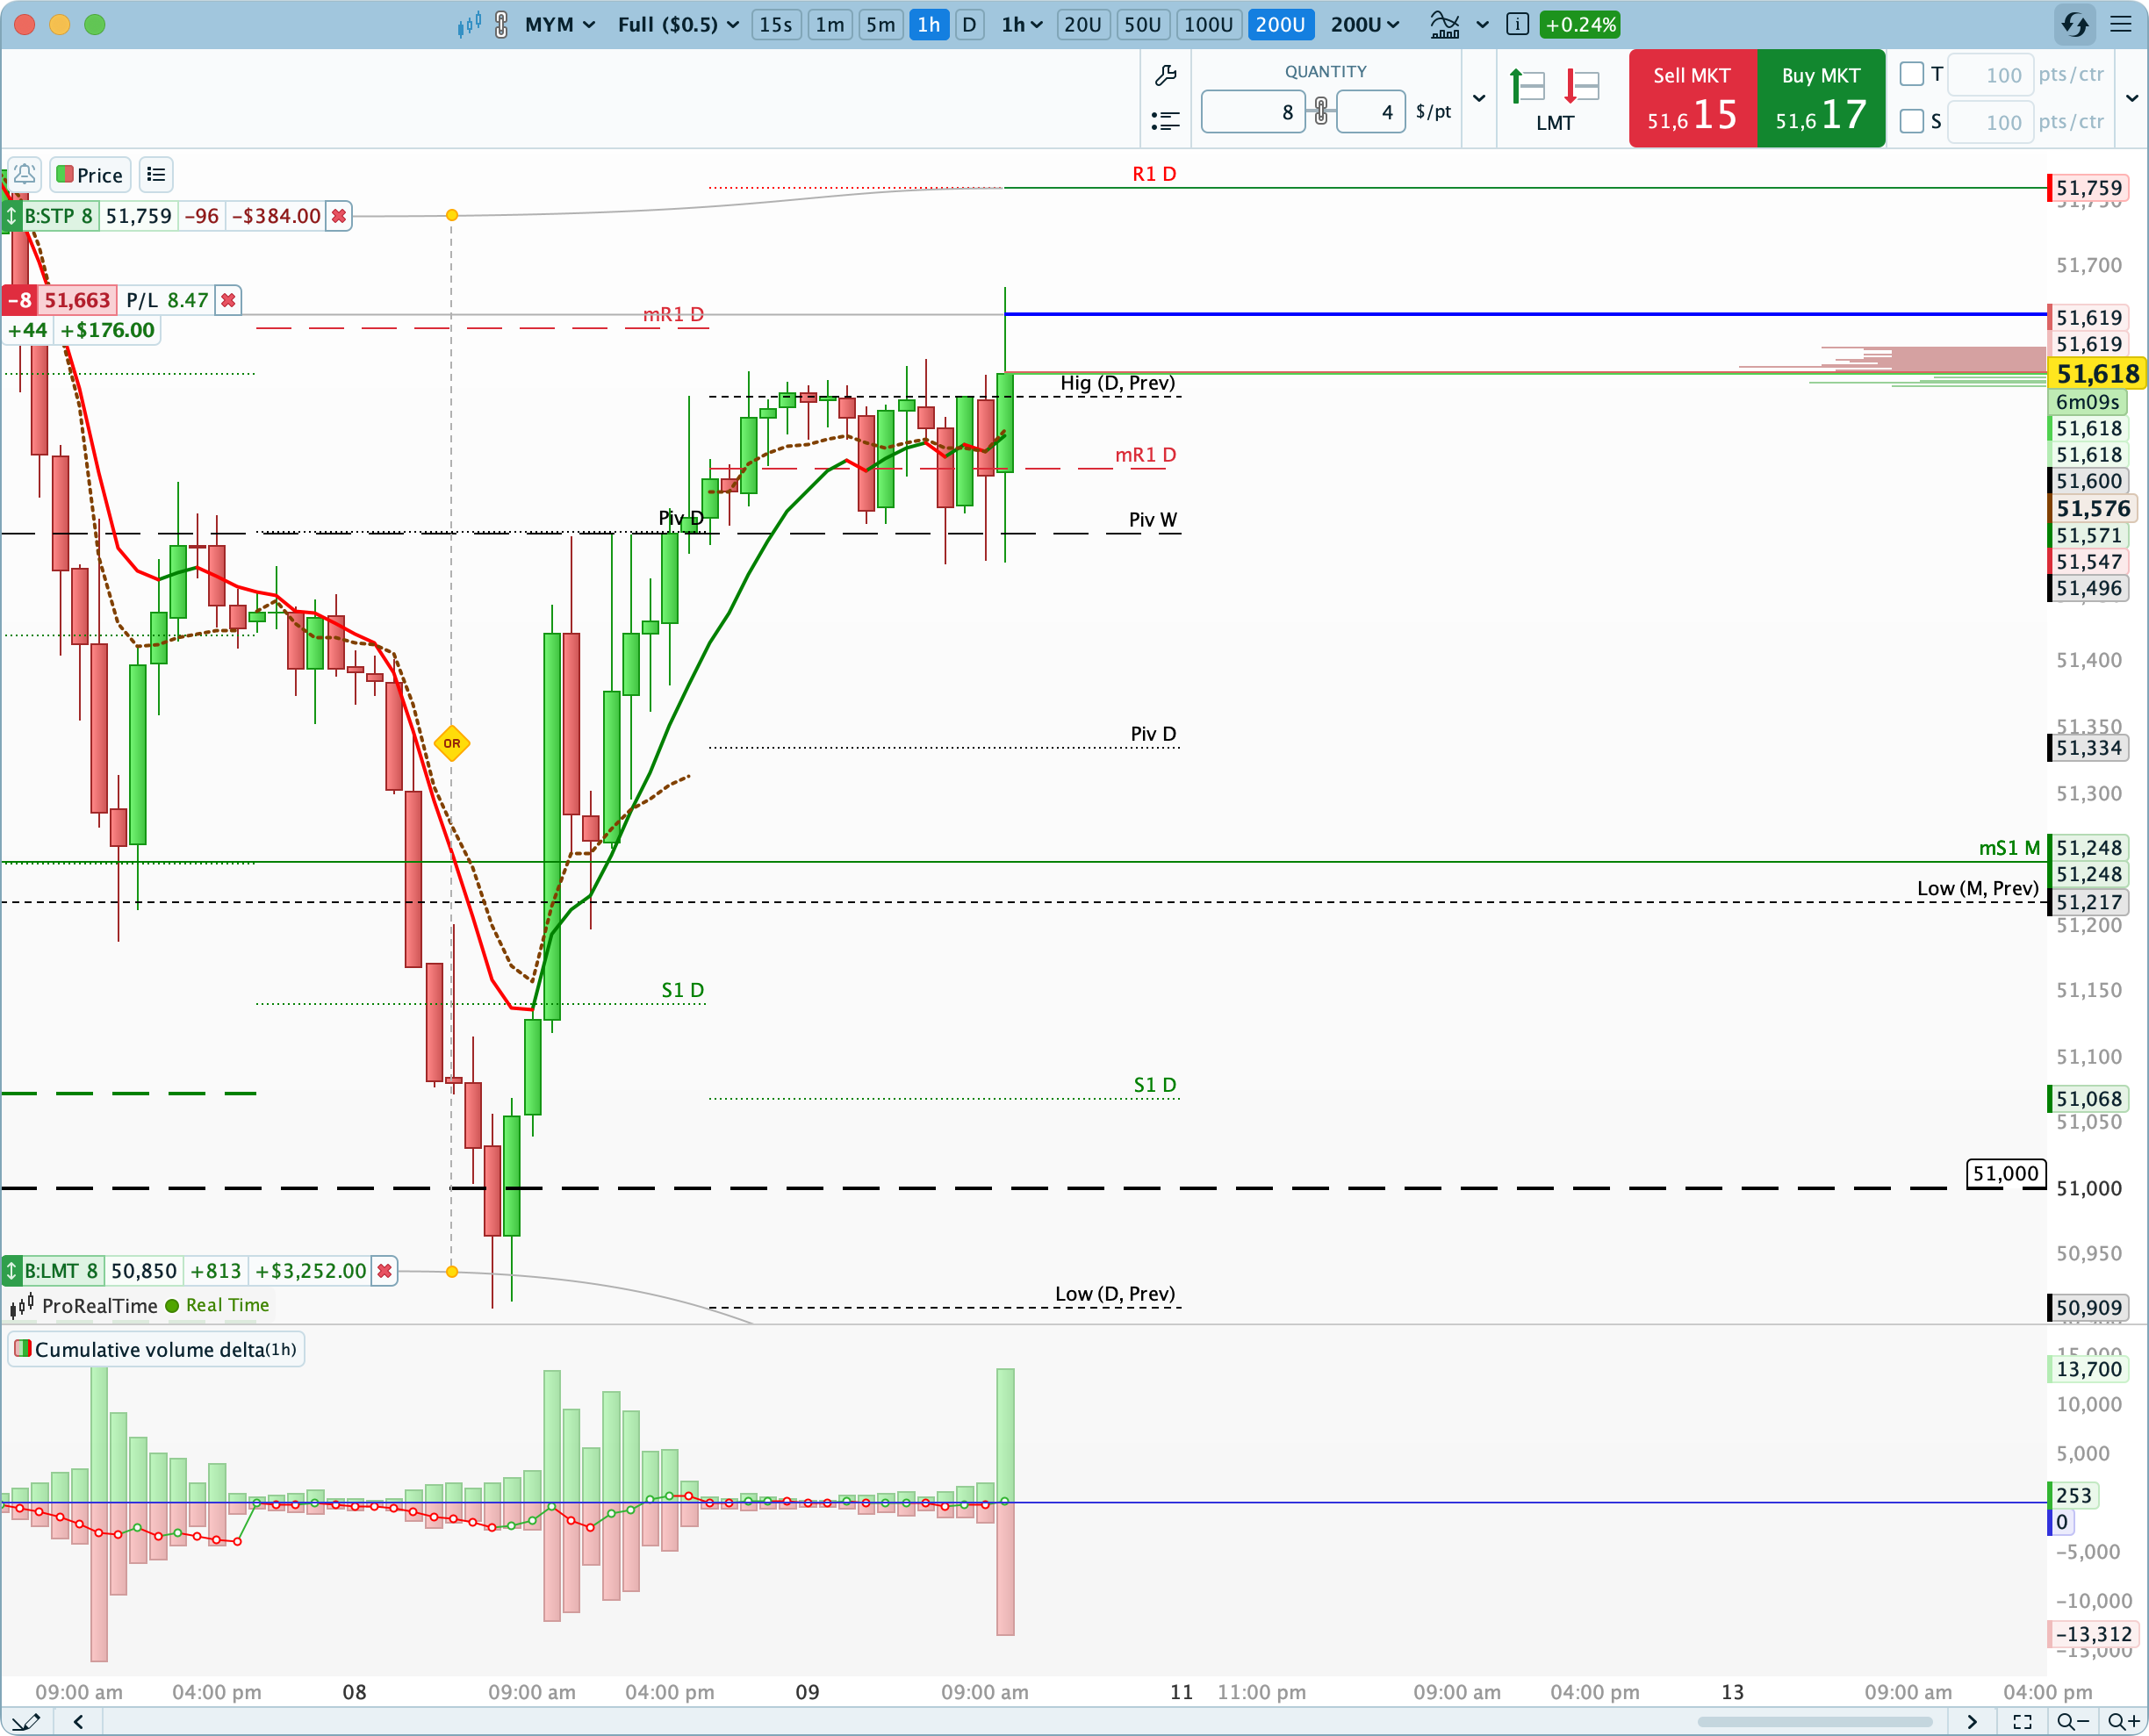
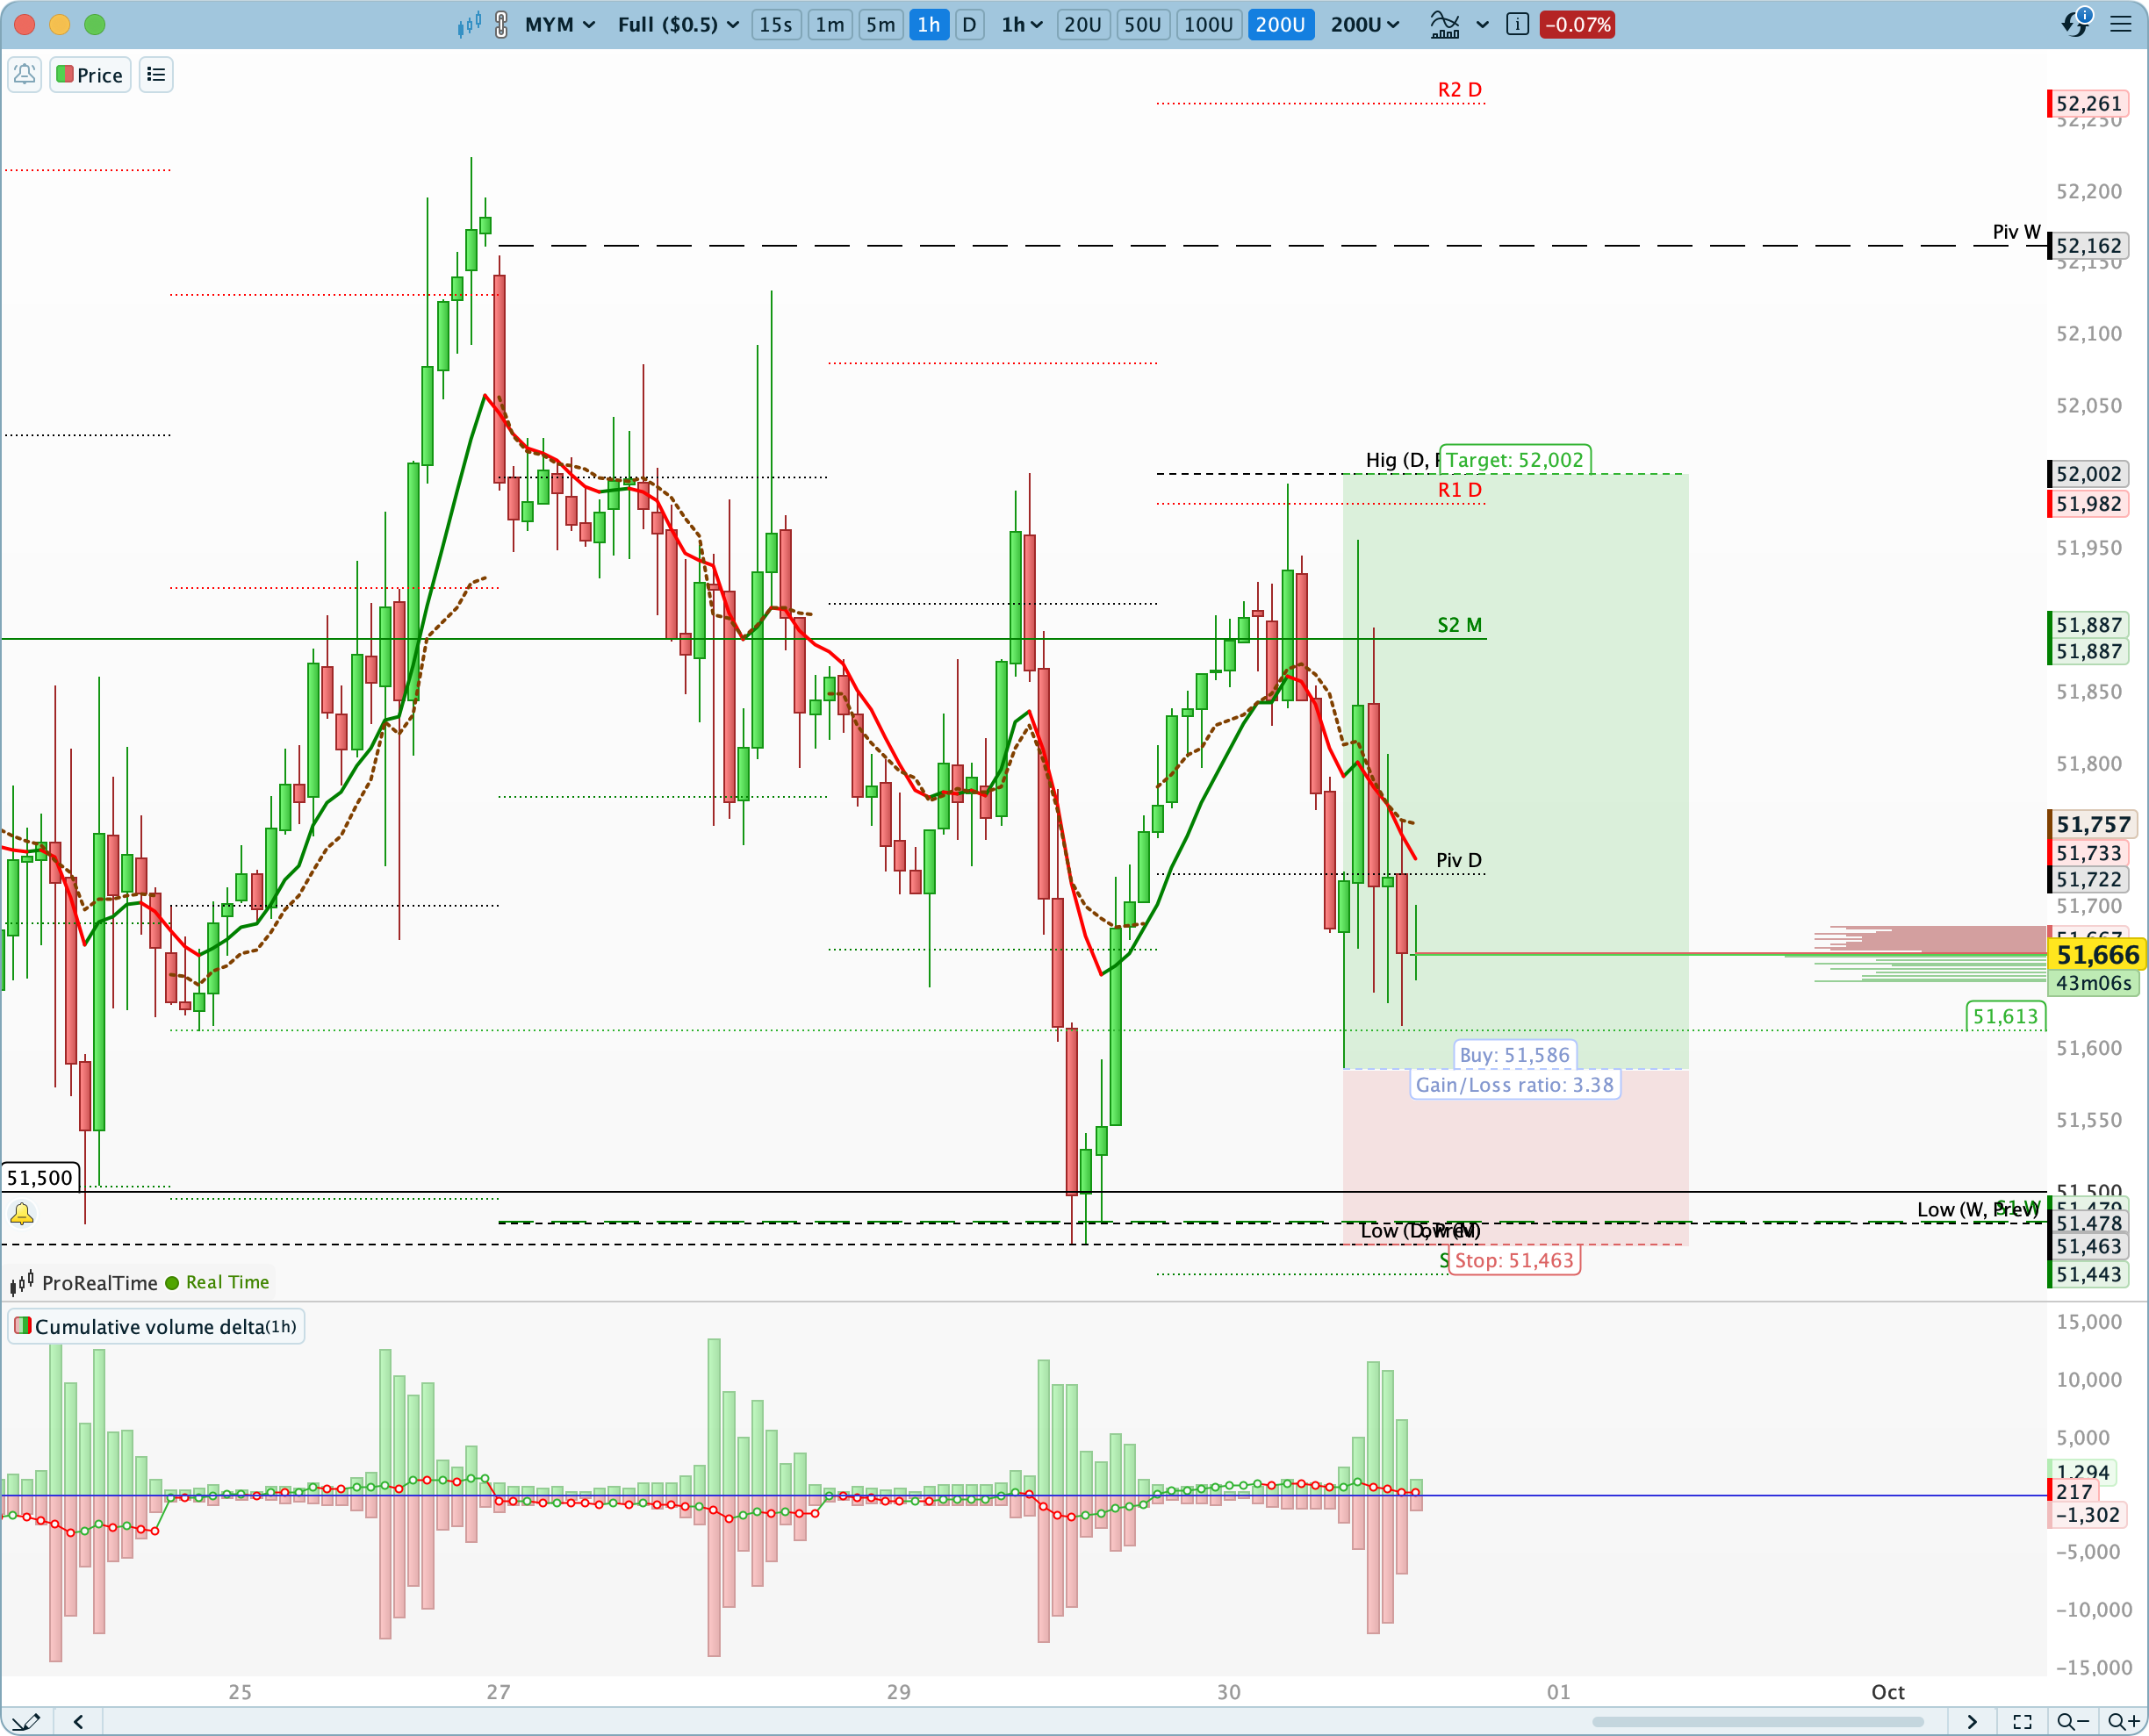
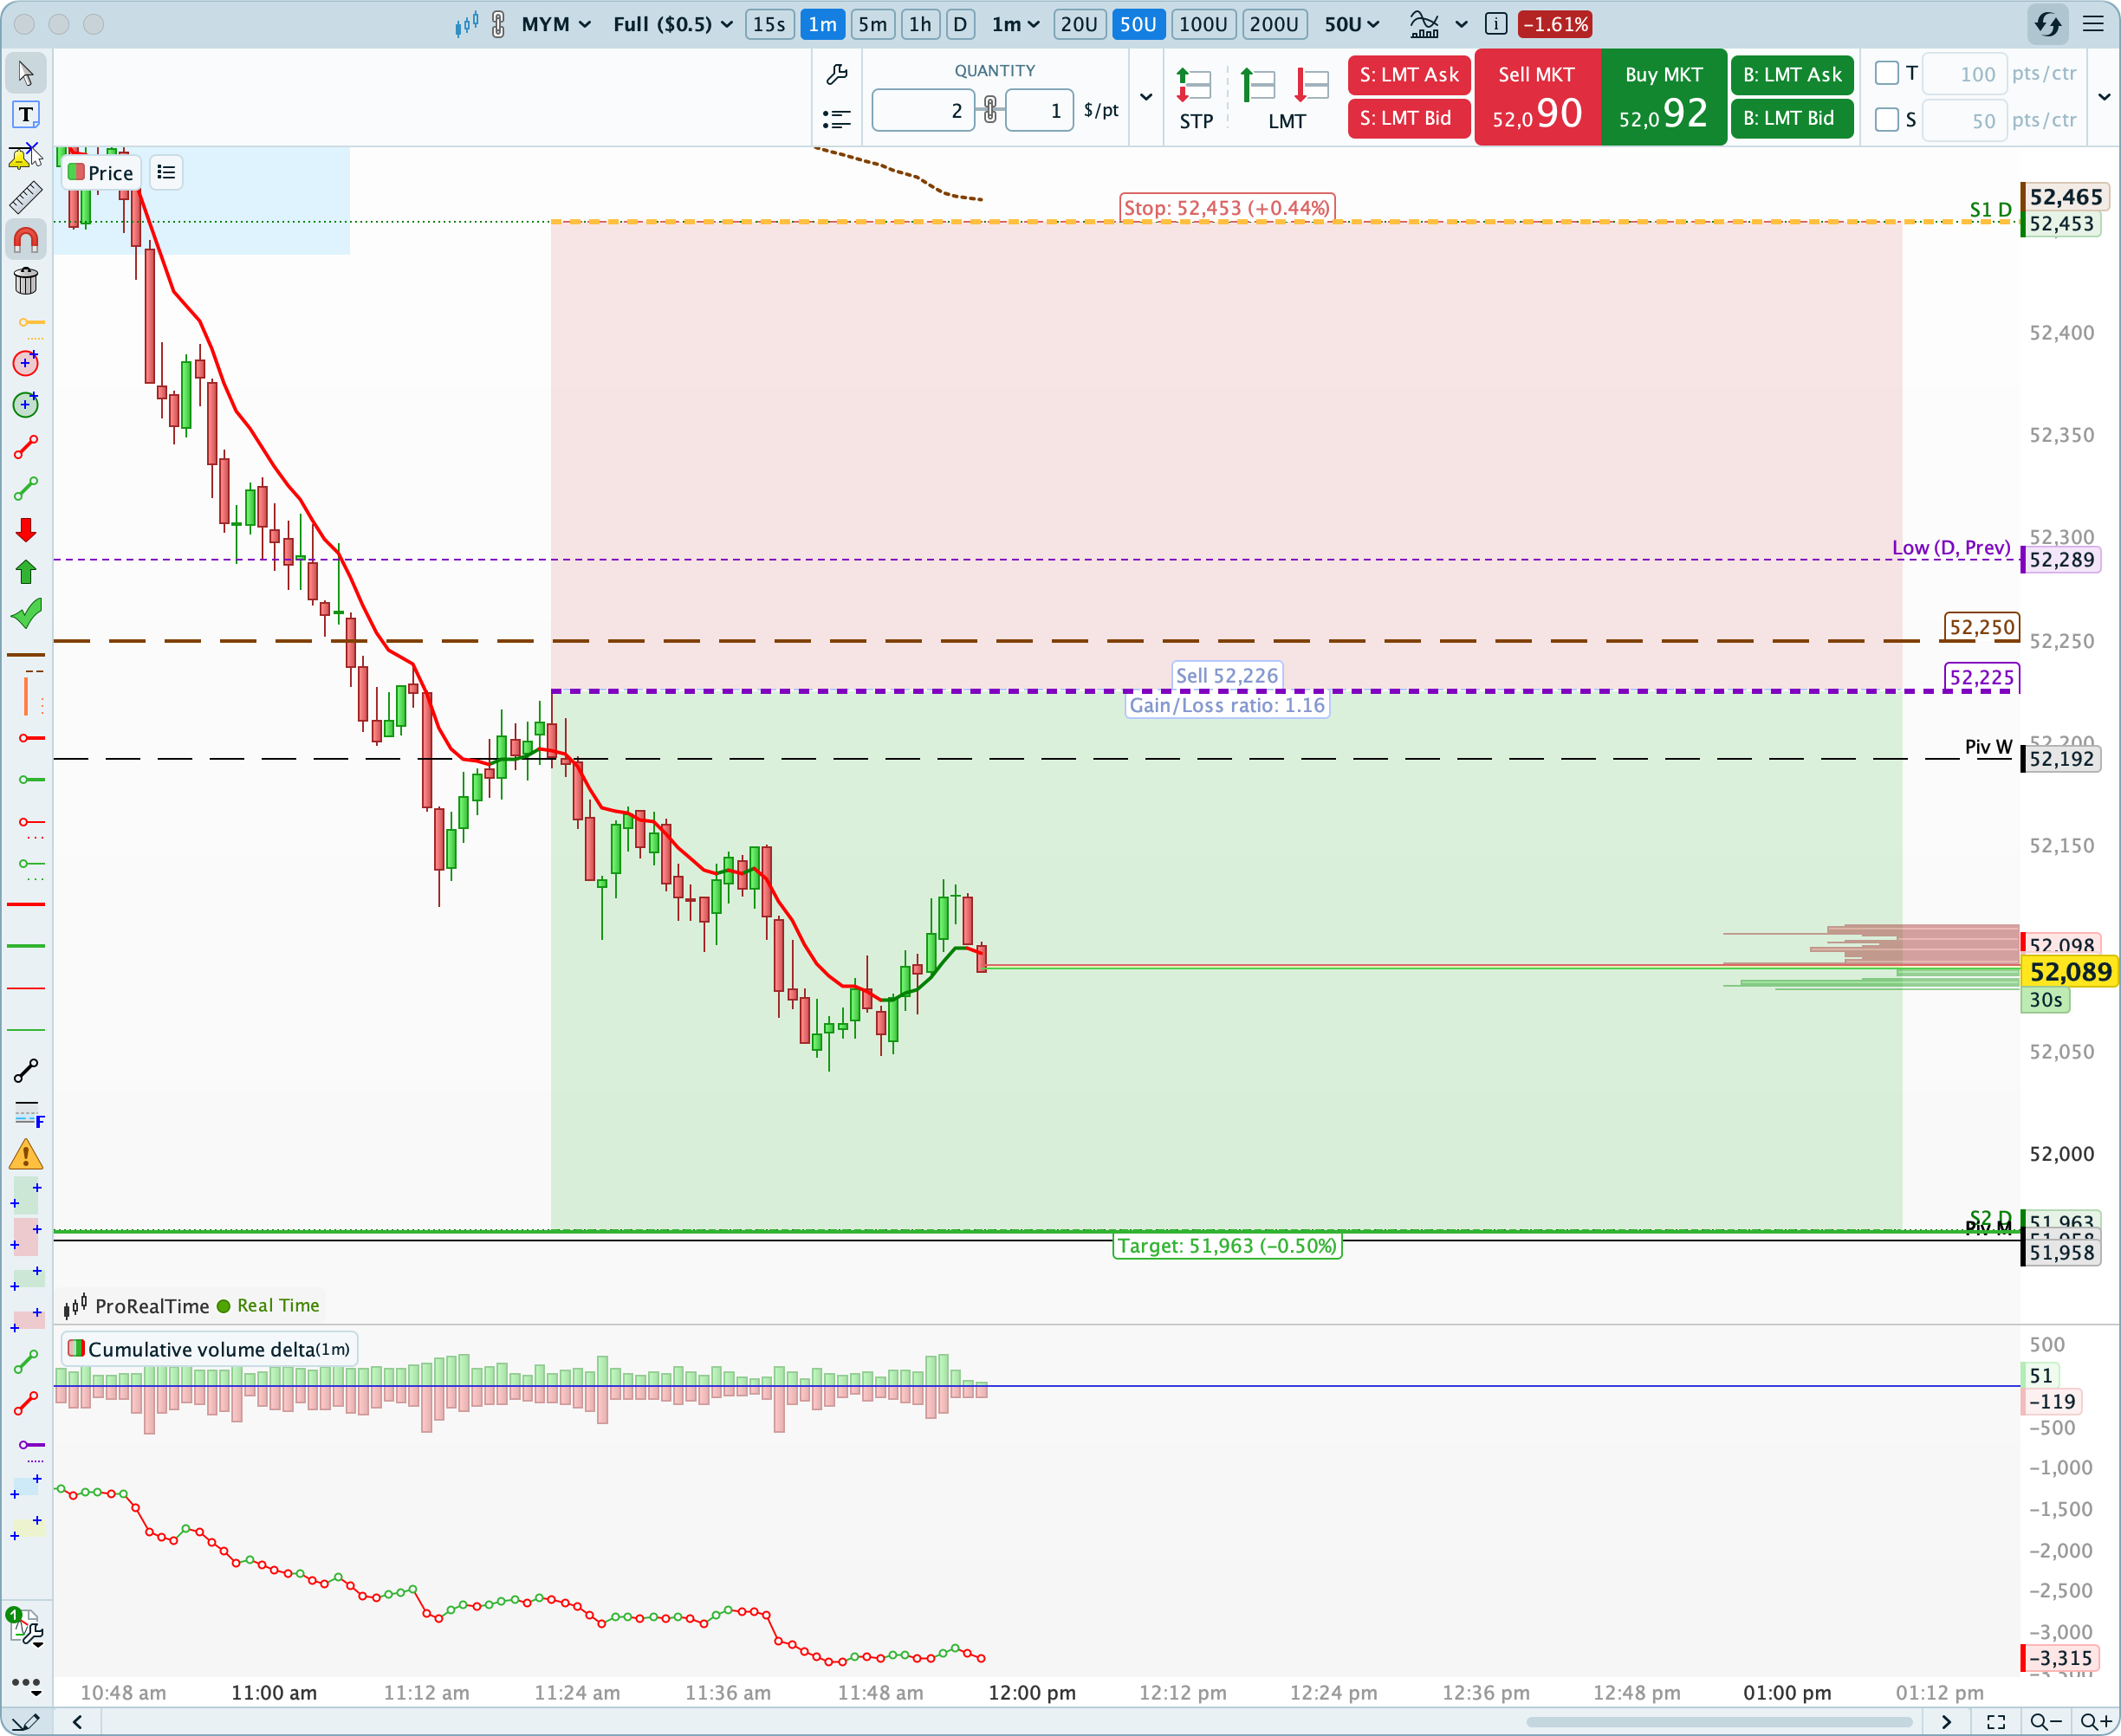
Selling the wave of optimism (triggered by the break above the monthly pivot point) to bet on the failure of the buying push toward the weekly resistance 1. Target: go grab the buyers' stop-losses placed below yesterday's low.
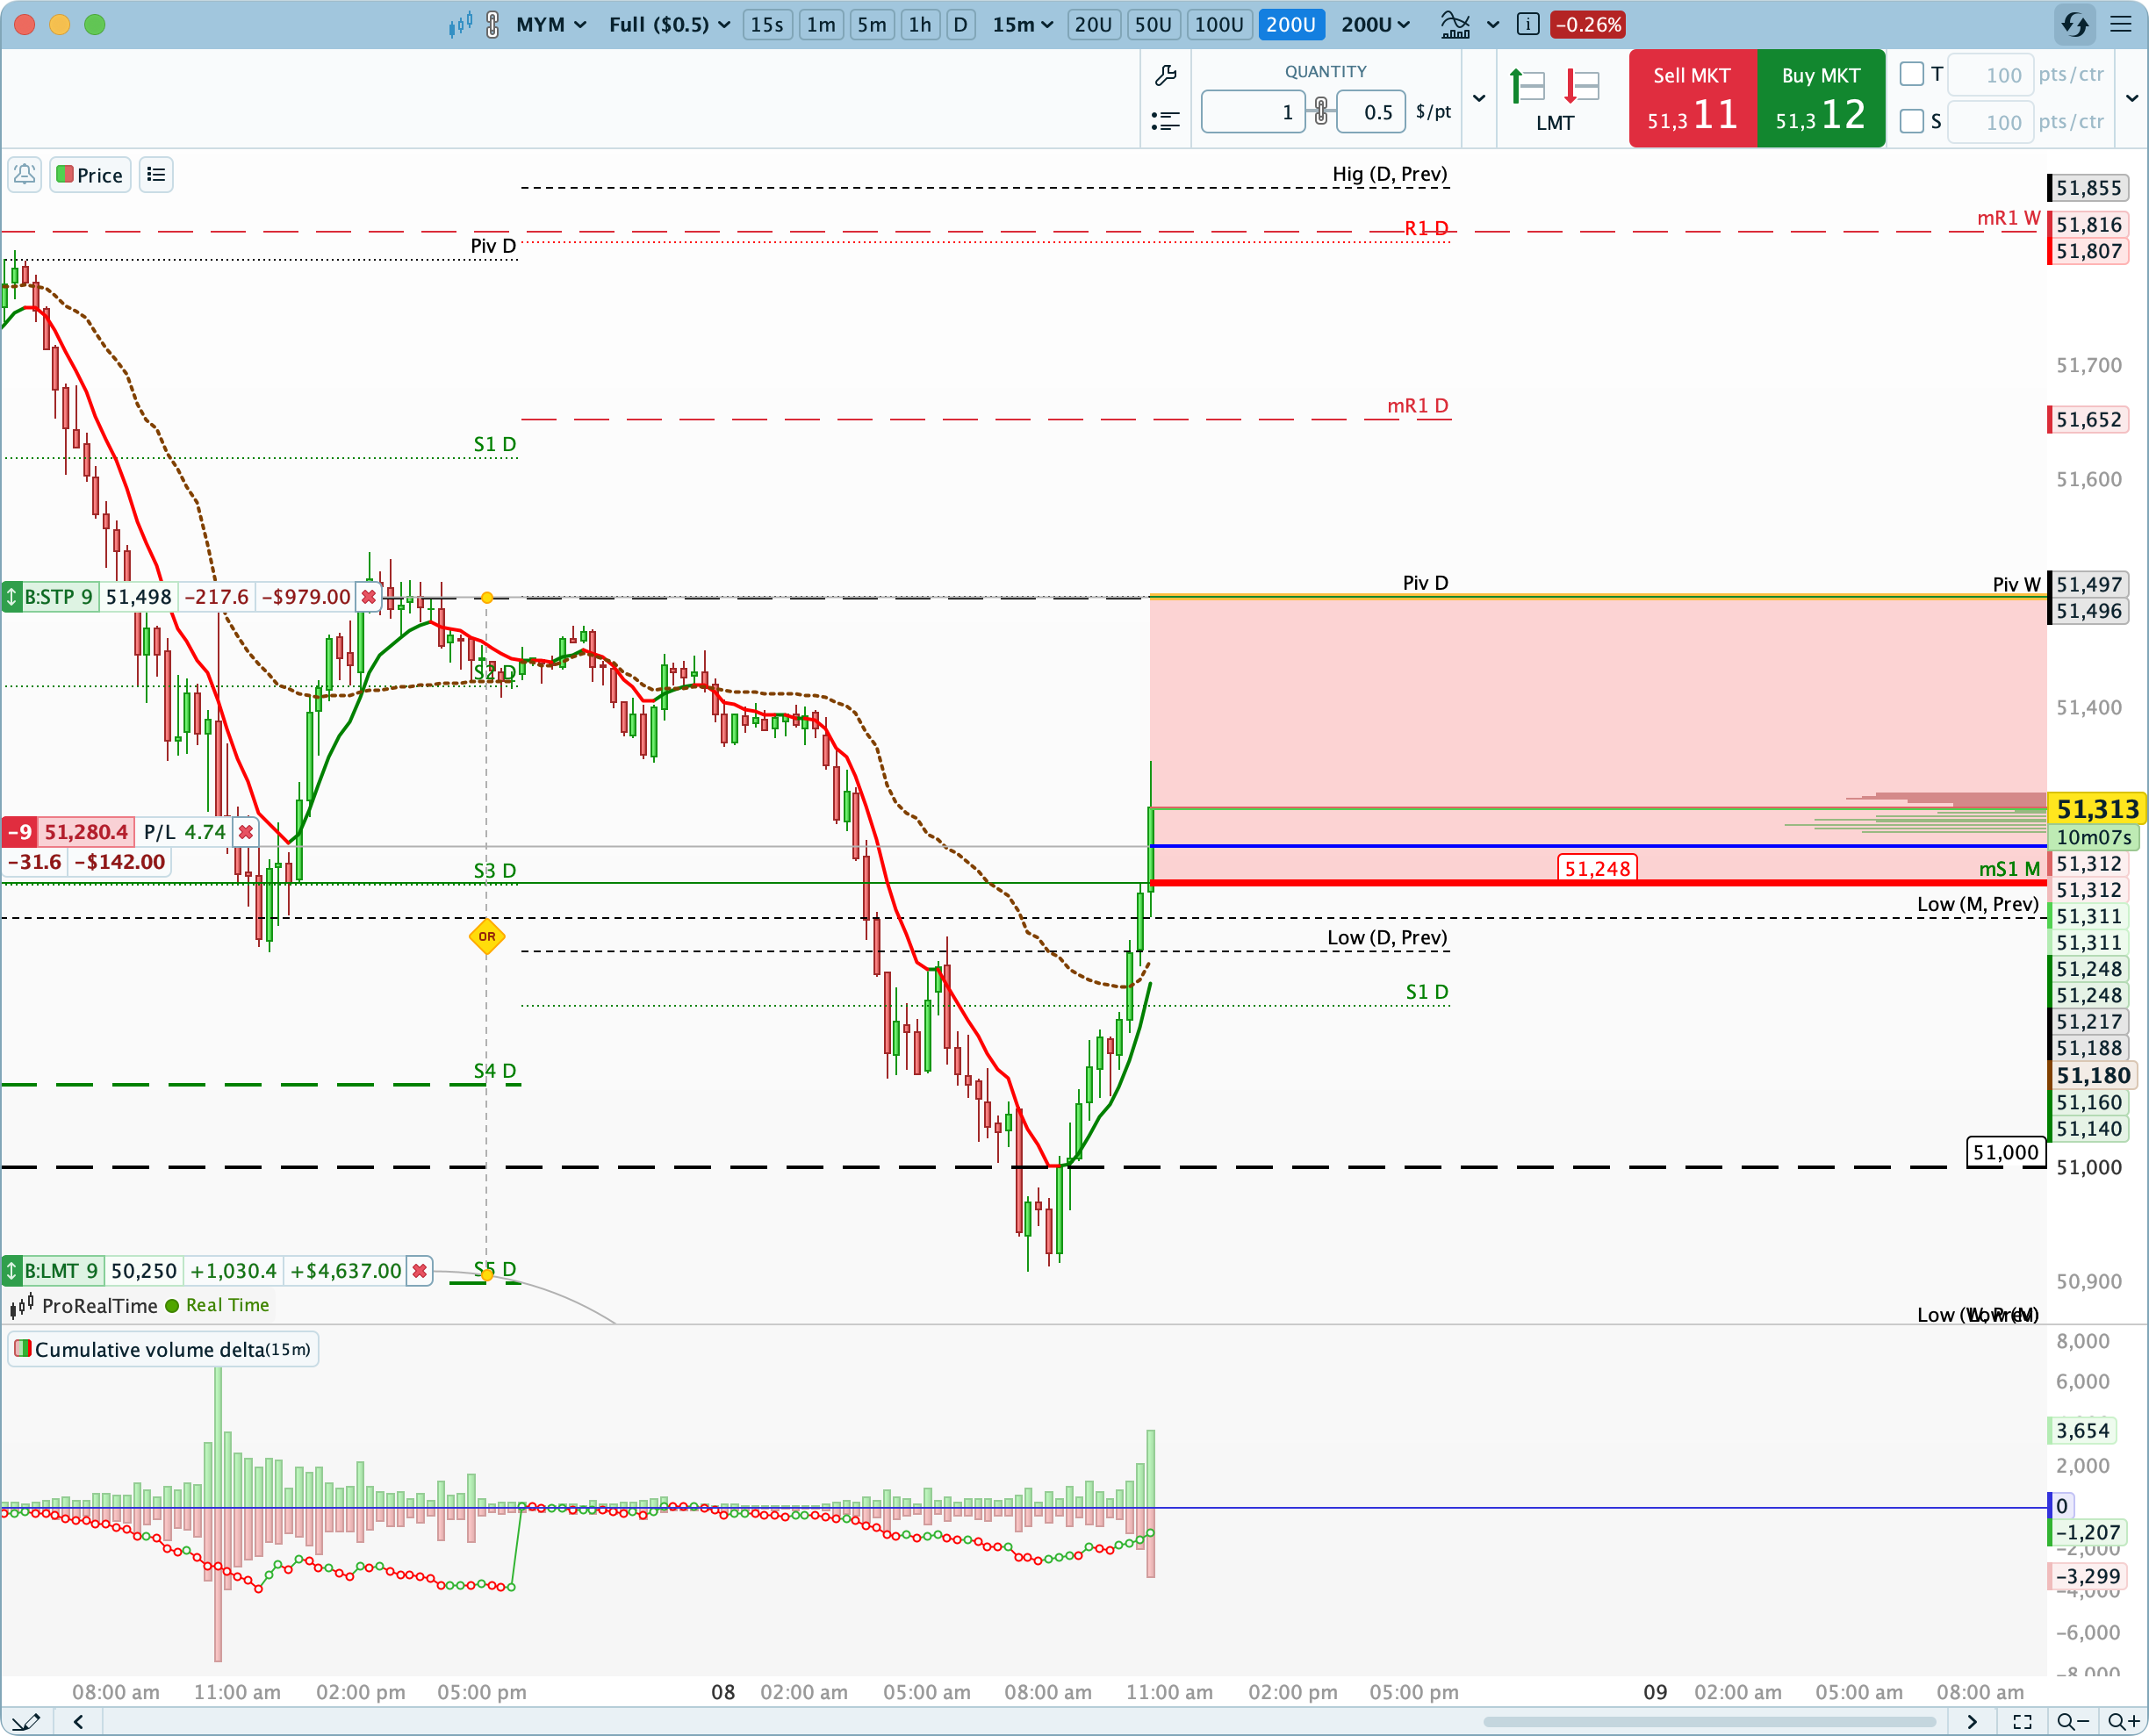
Selling the wave of optimism (triggered by the break above the symbolic 52000-point level at the open) to bet on the failure of the buyers' push towards the monthly pivot point.
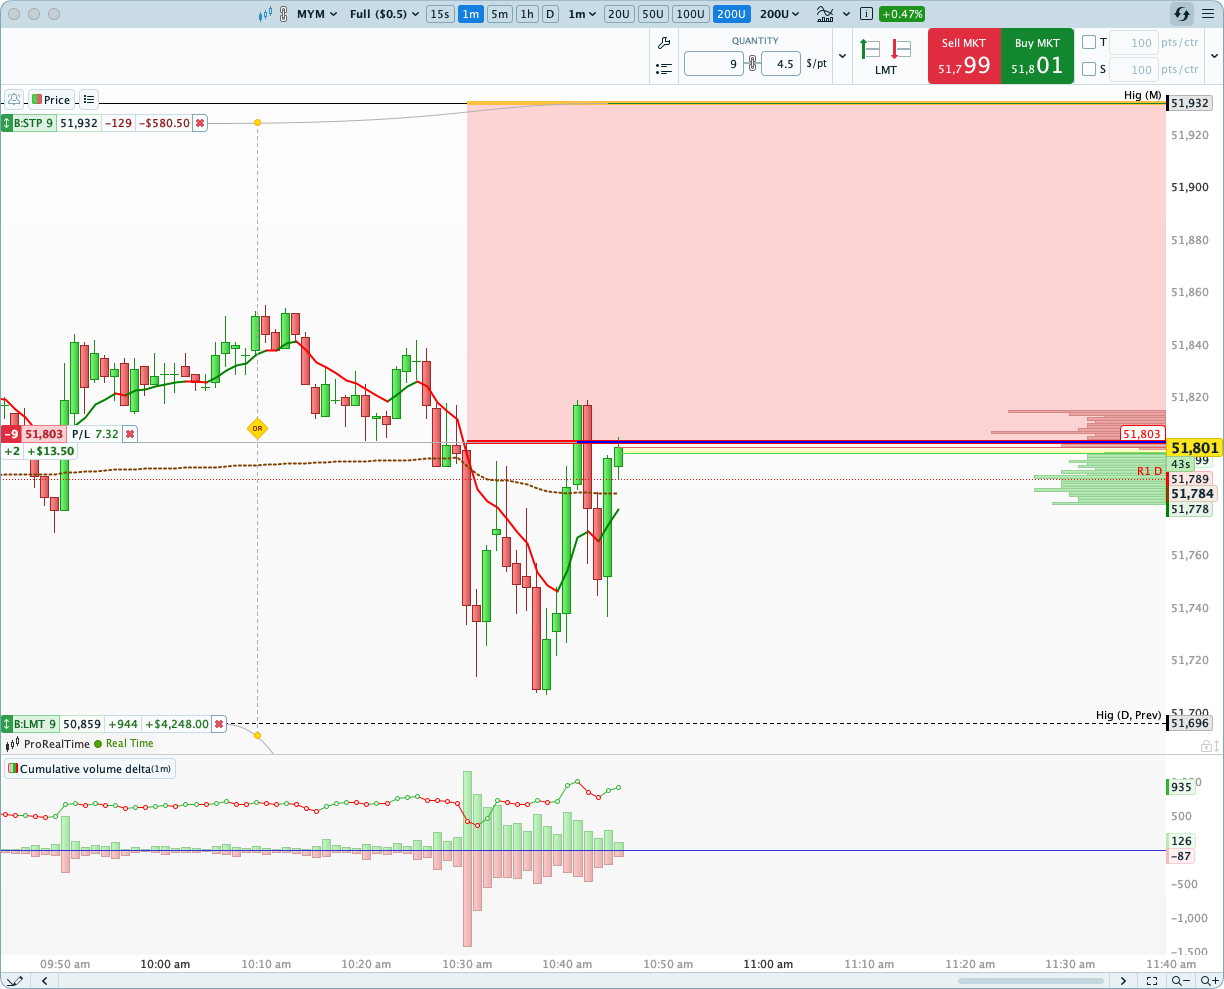
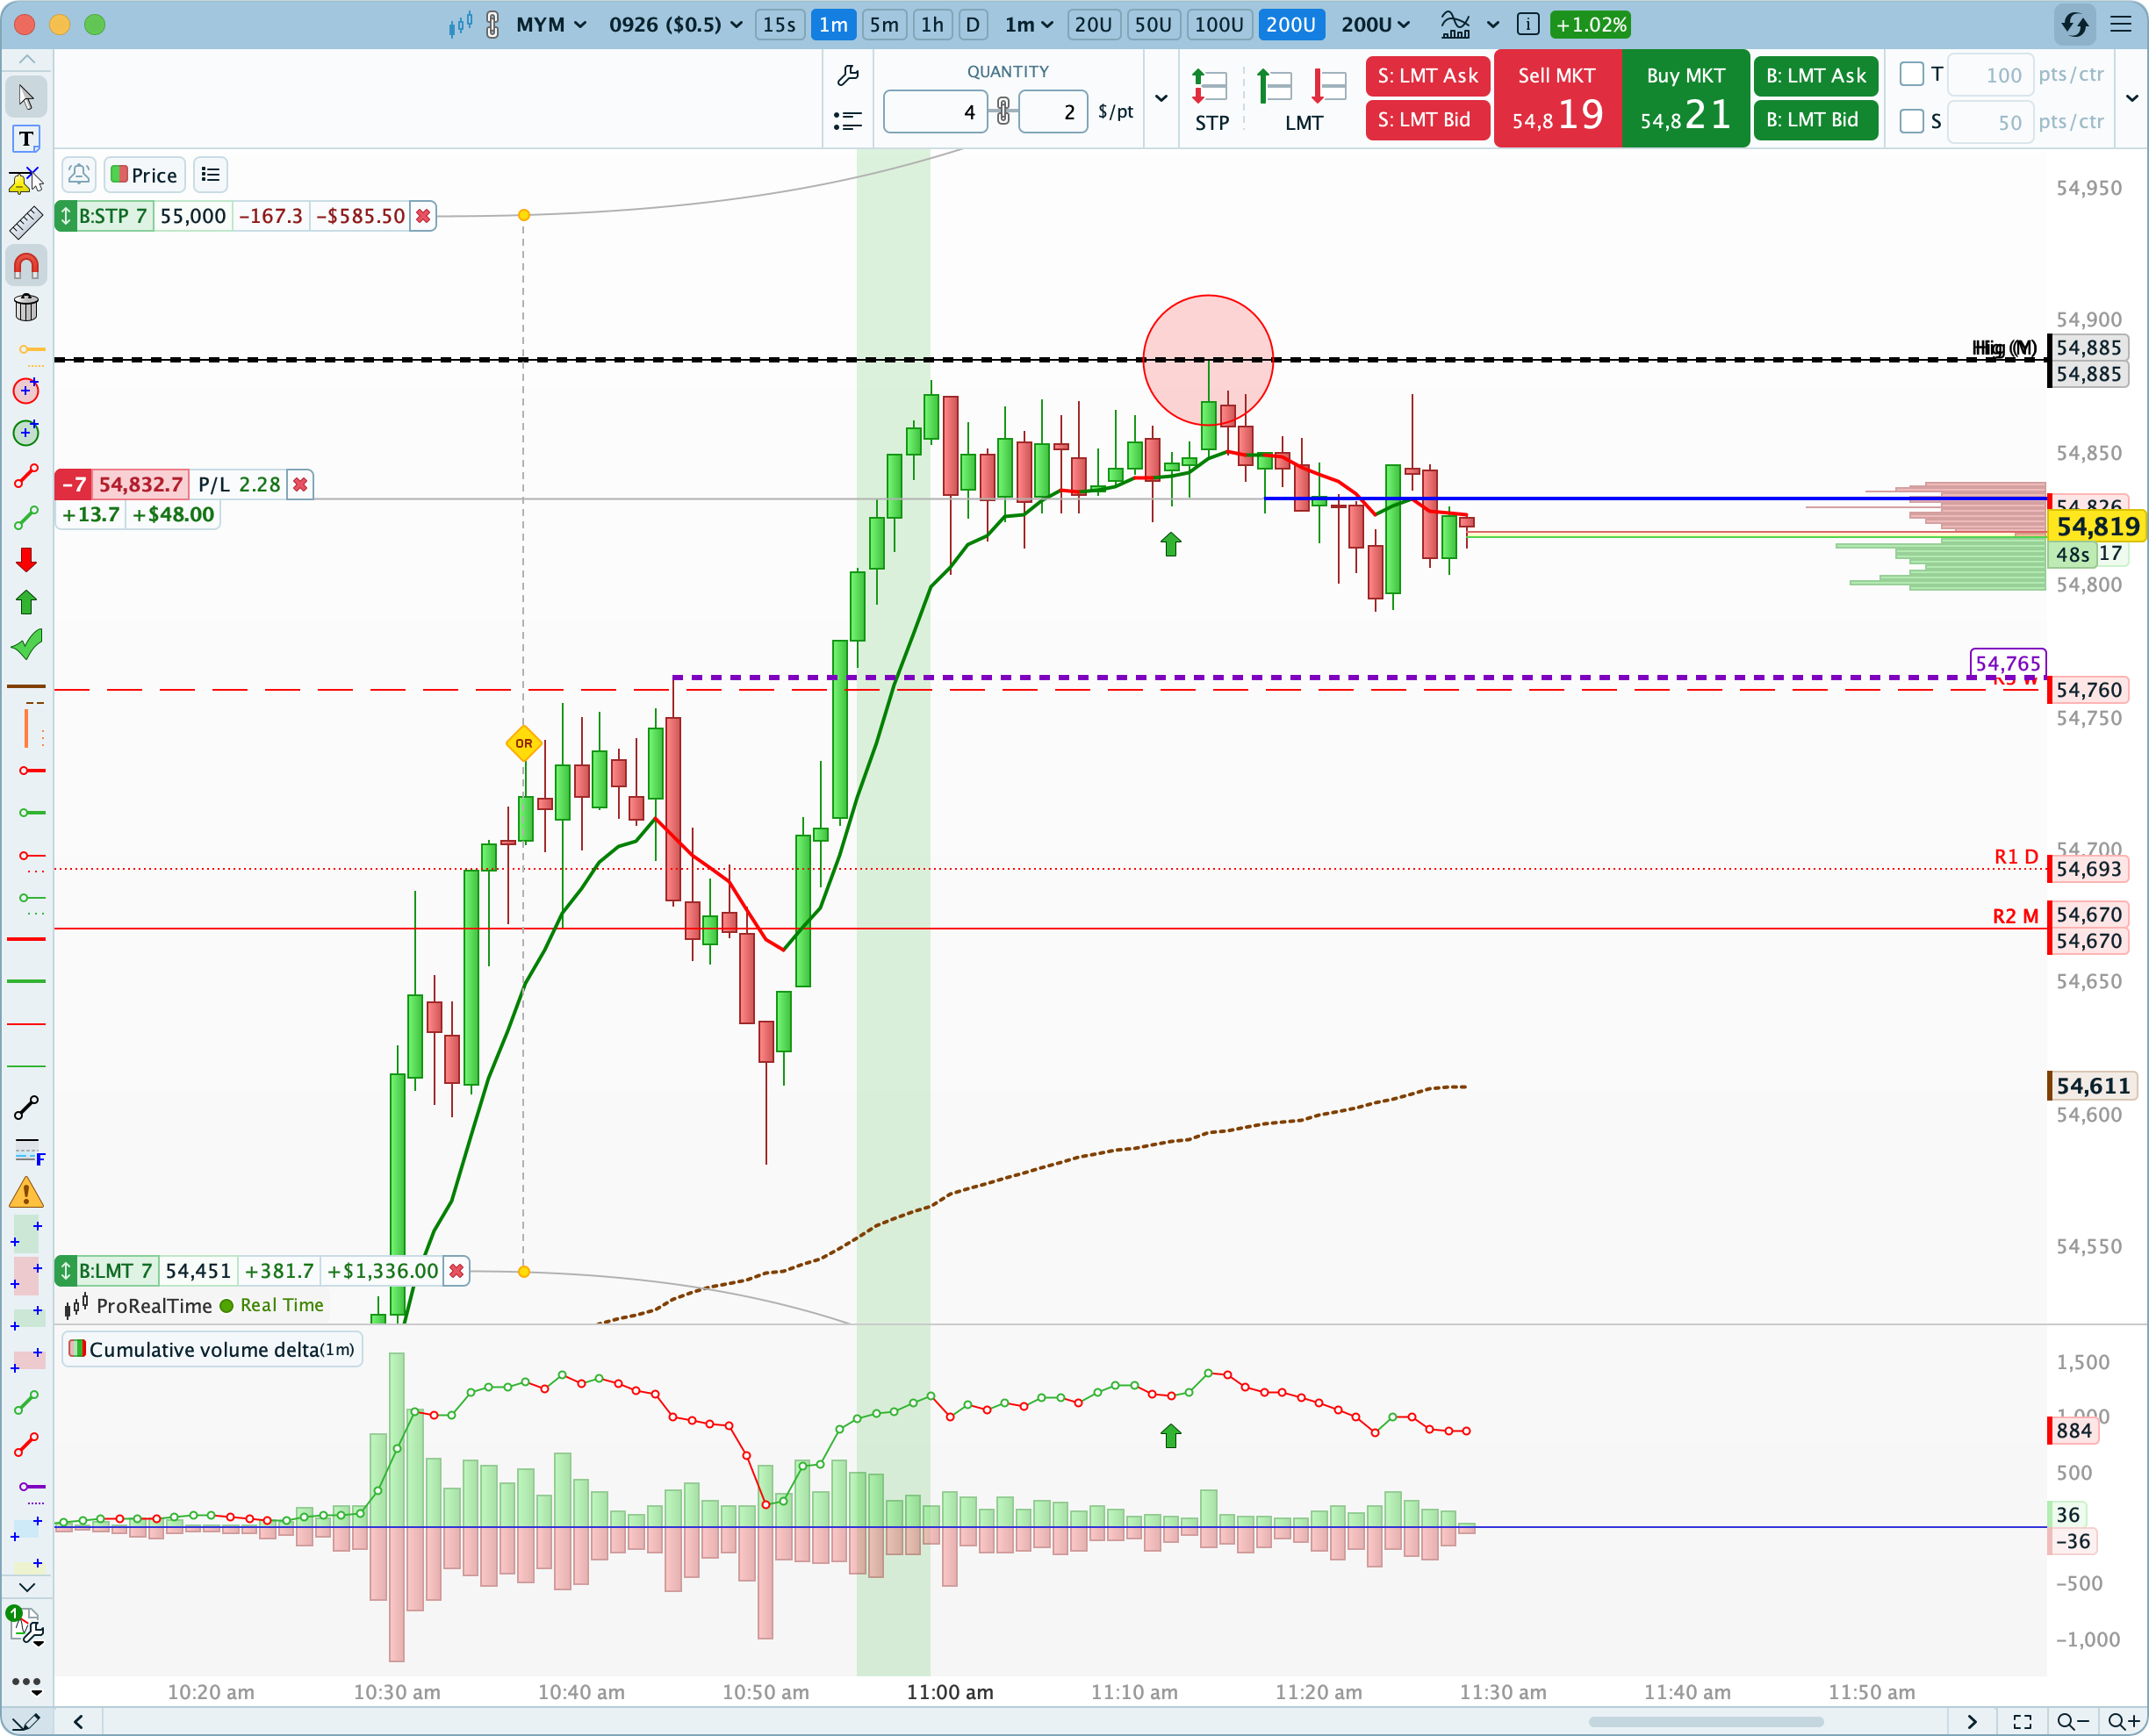
Selling the wave of optimism (triggered by the reclaim of the daily pivot point) to bet on the failure of the buying offensive targeting the monthly pivot point.
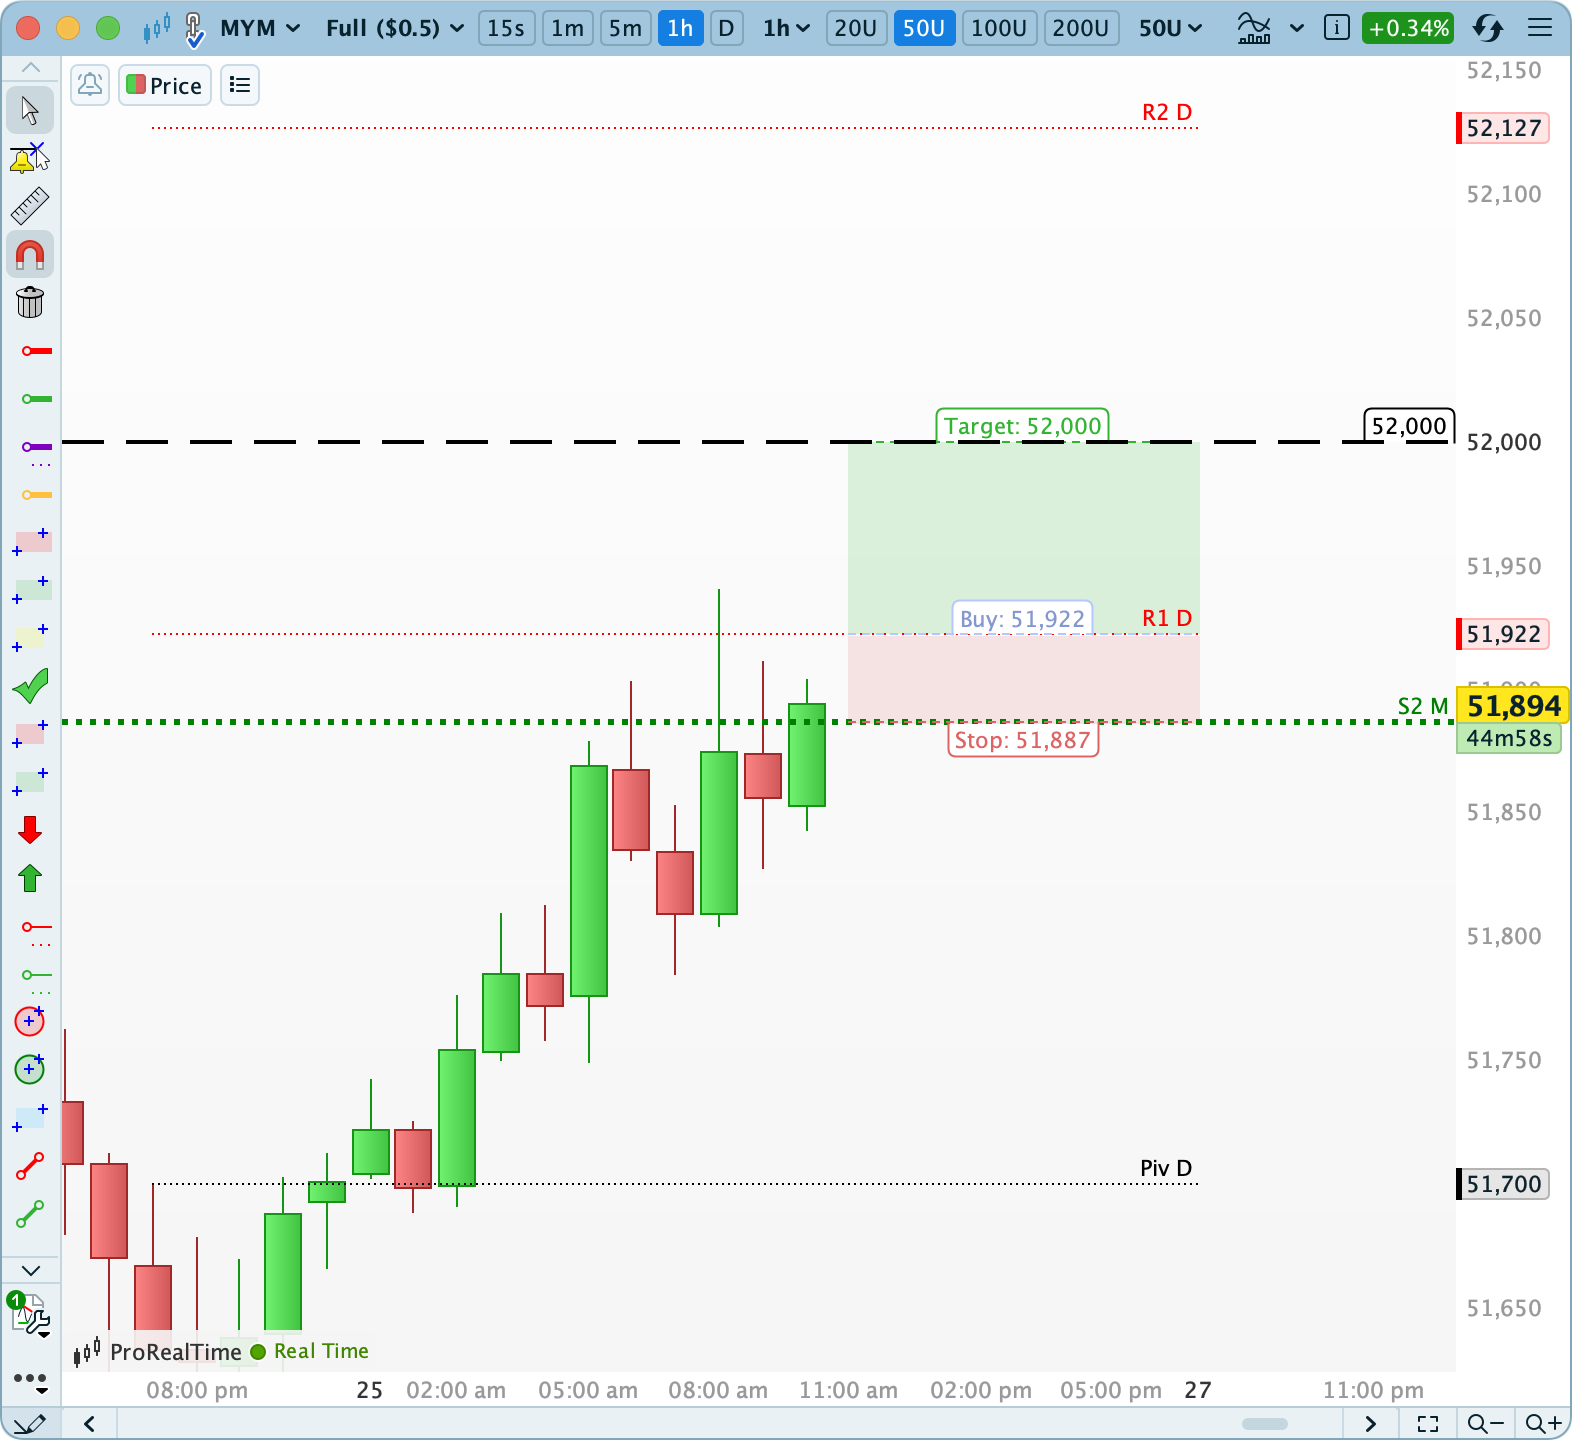
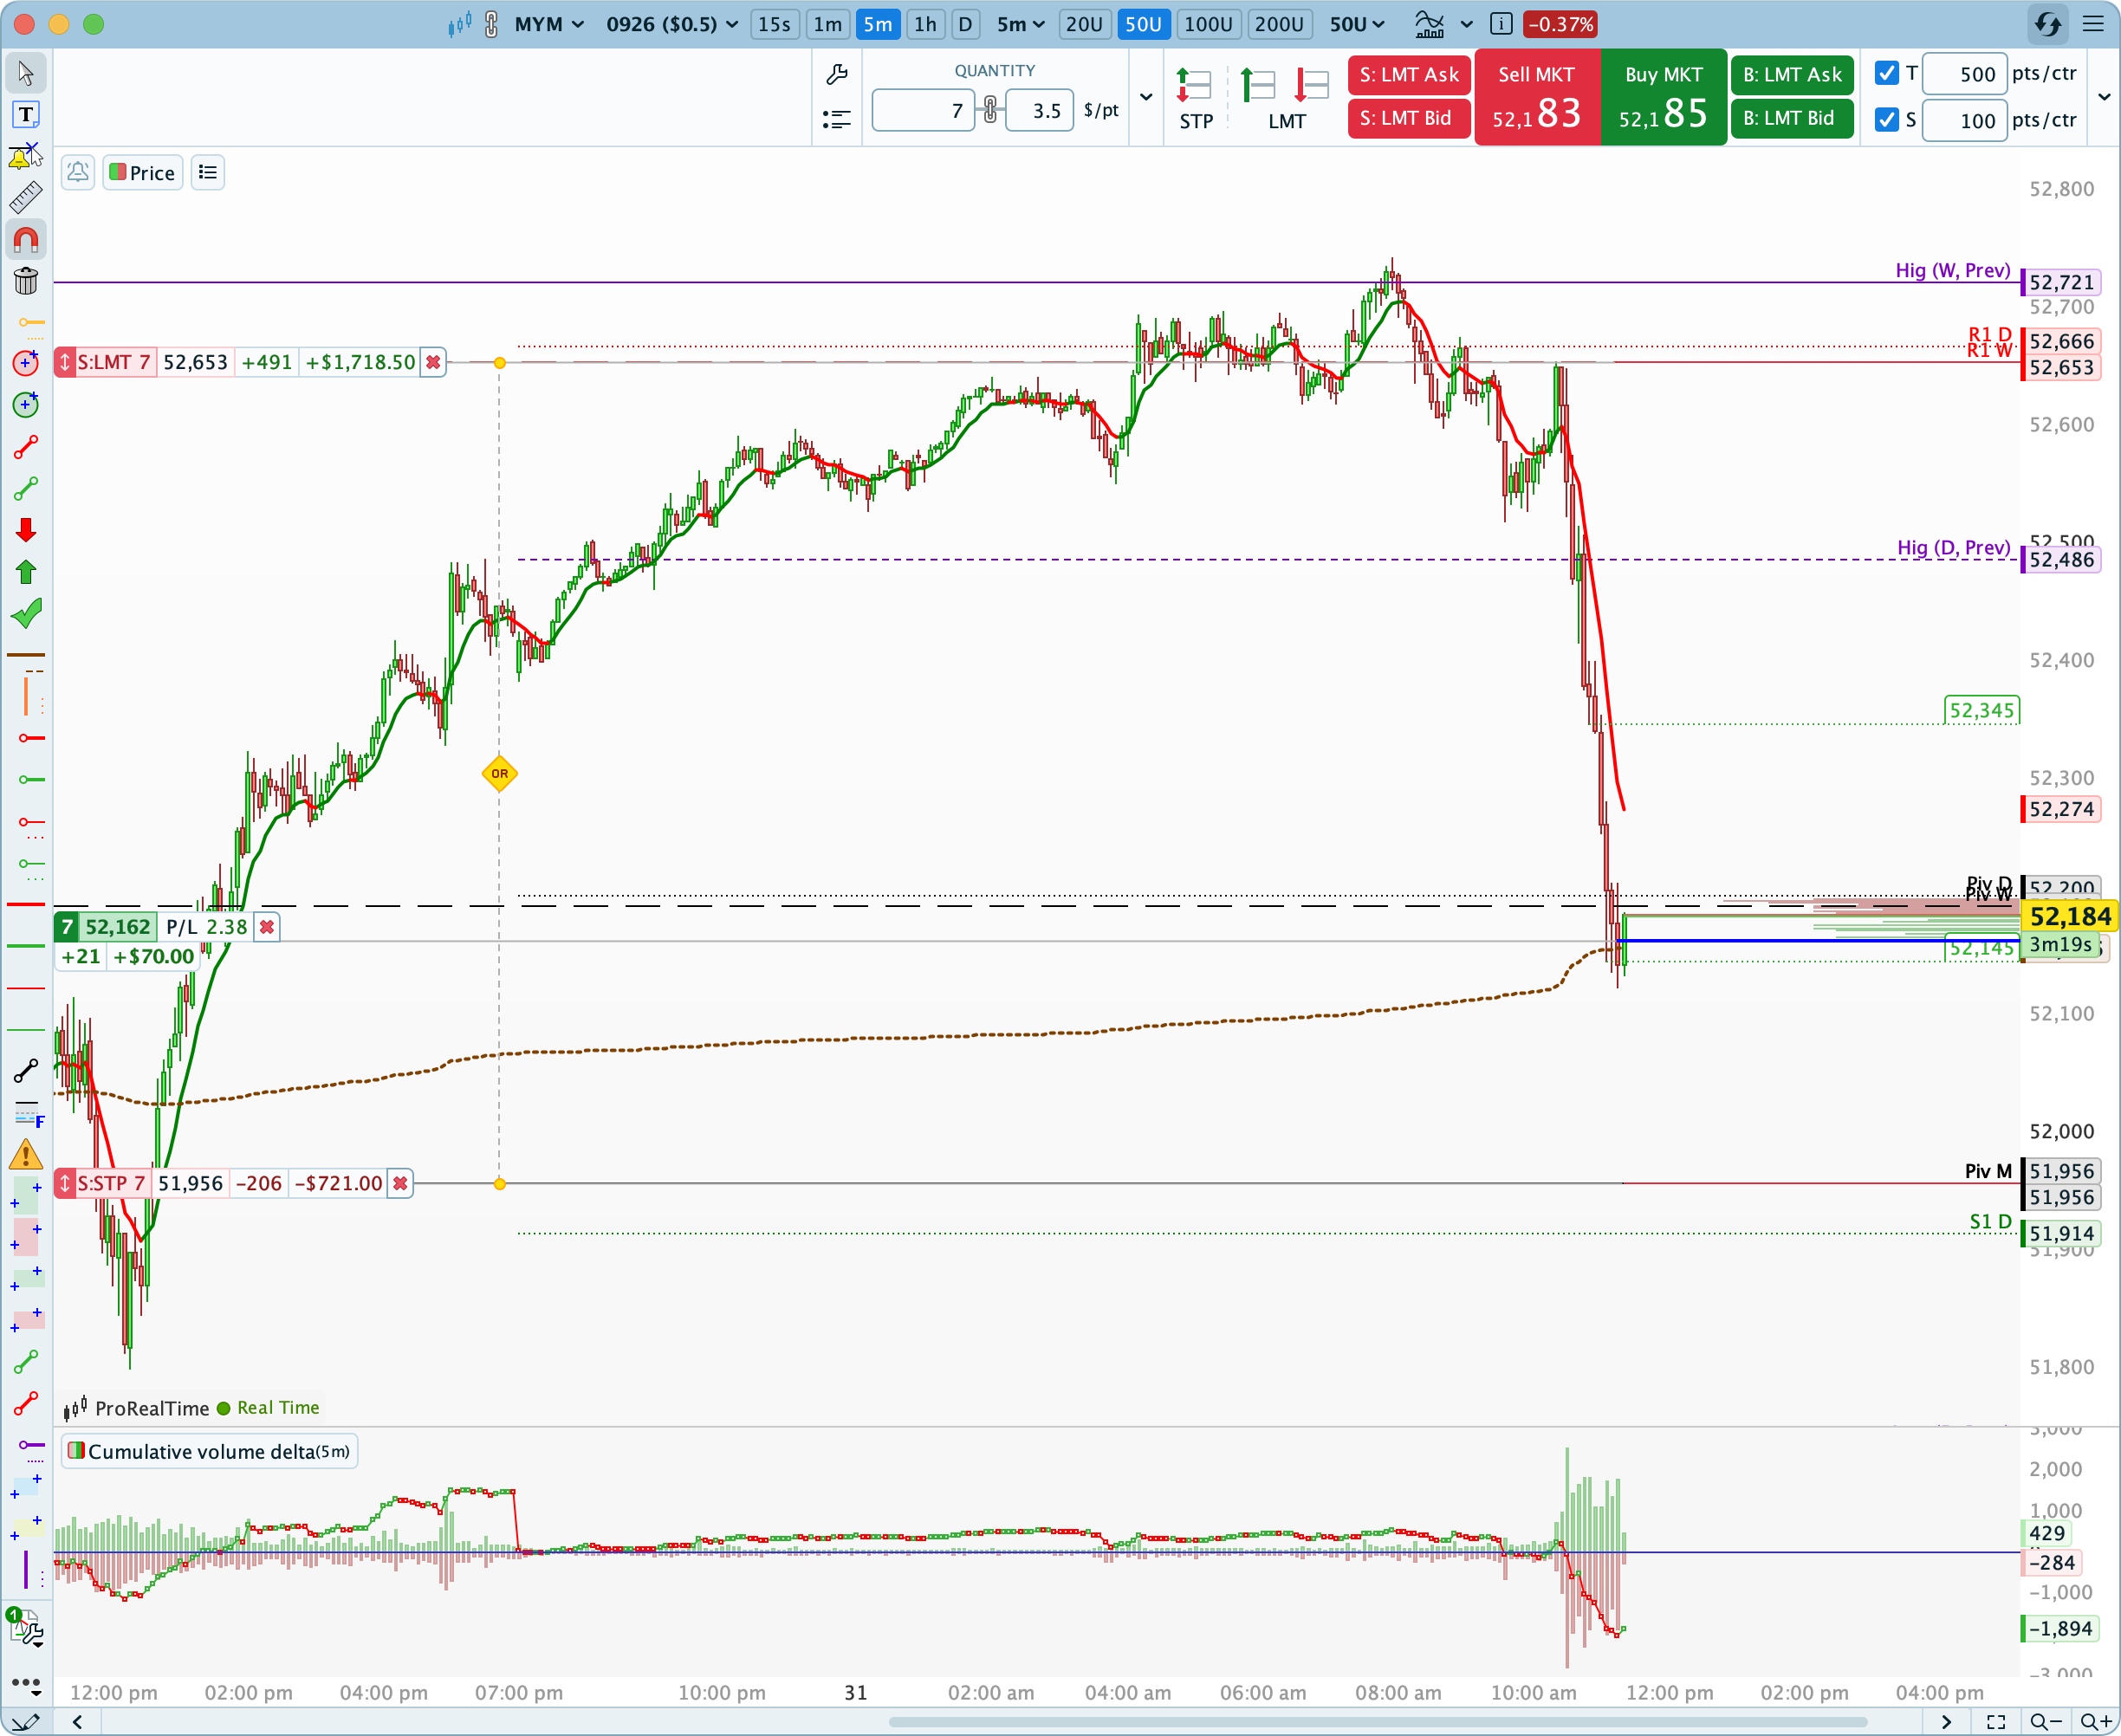
The Dow Jones index is still in a bearish trend, but a rebound looks possible to me. Short sellers managed to take their profits at the weekly low, and buyers were able to regain their footing to rally toward monthly support 2.
Note: The trading signals now use stop orders (this lets me send them to you in advance). The training course will soon be updated so you can learn how to properly execute these educational signals on your simulator.
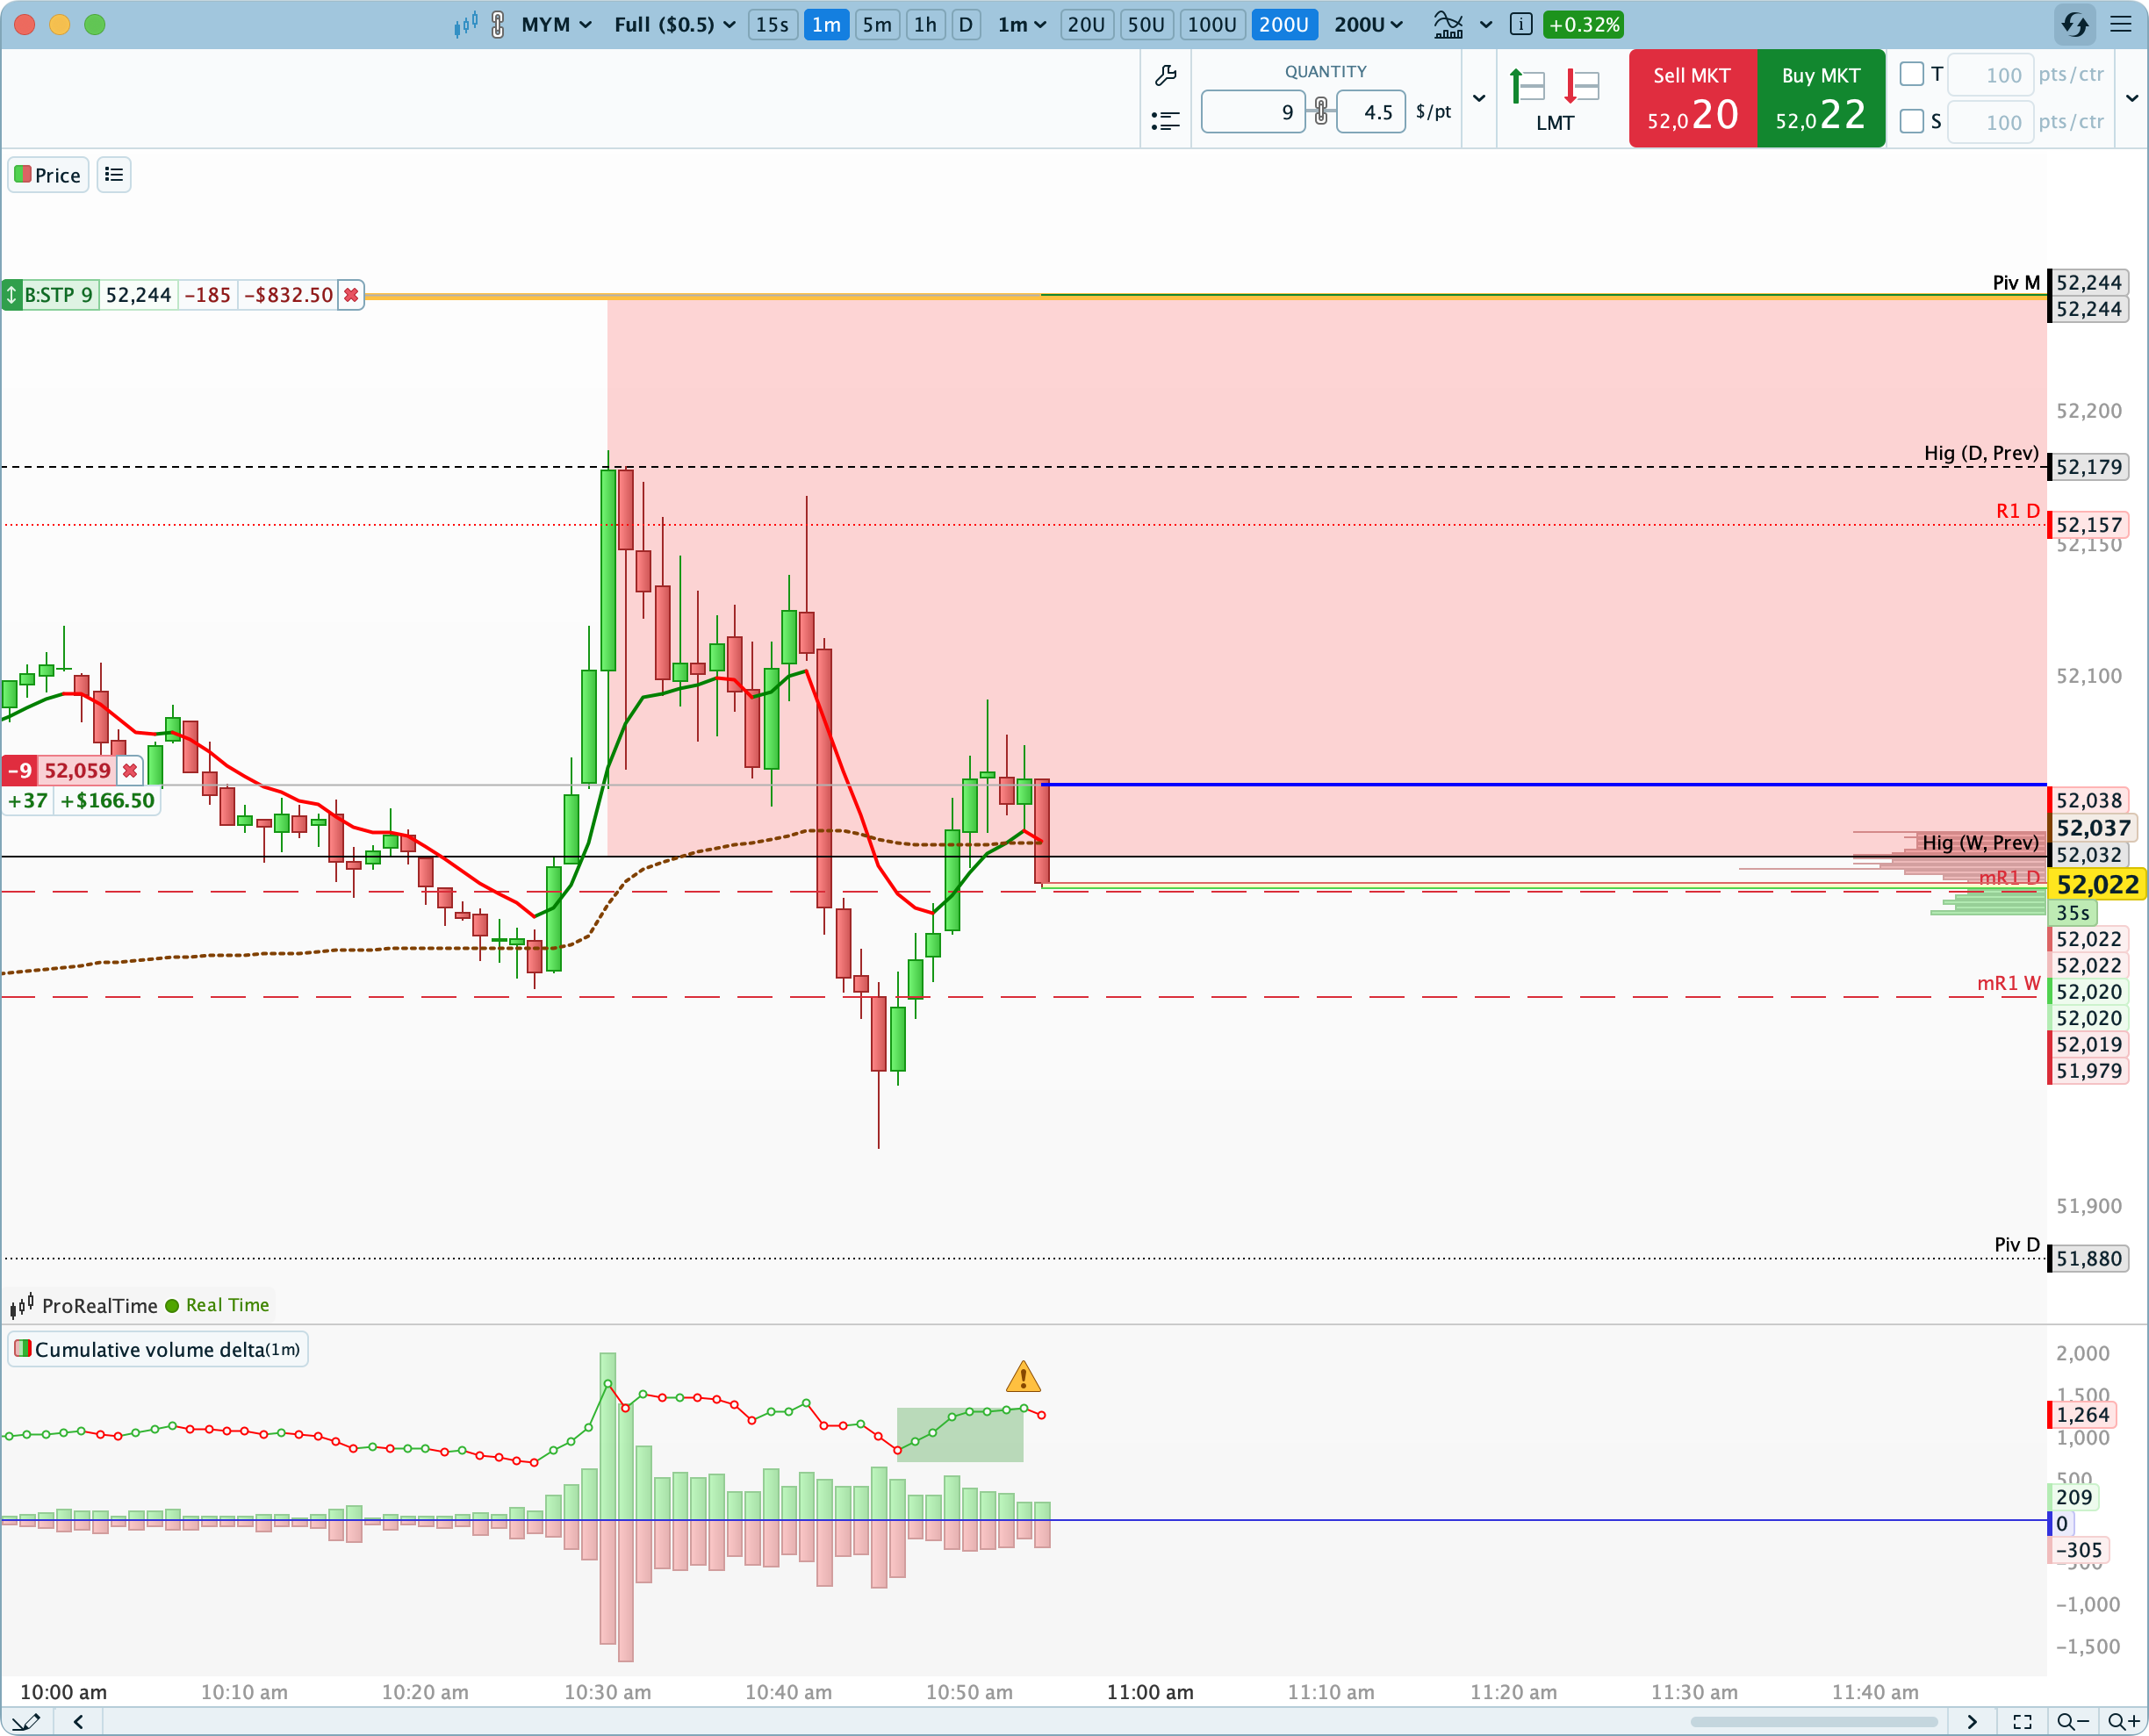
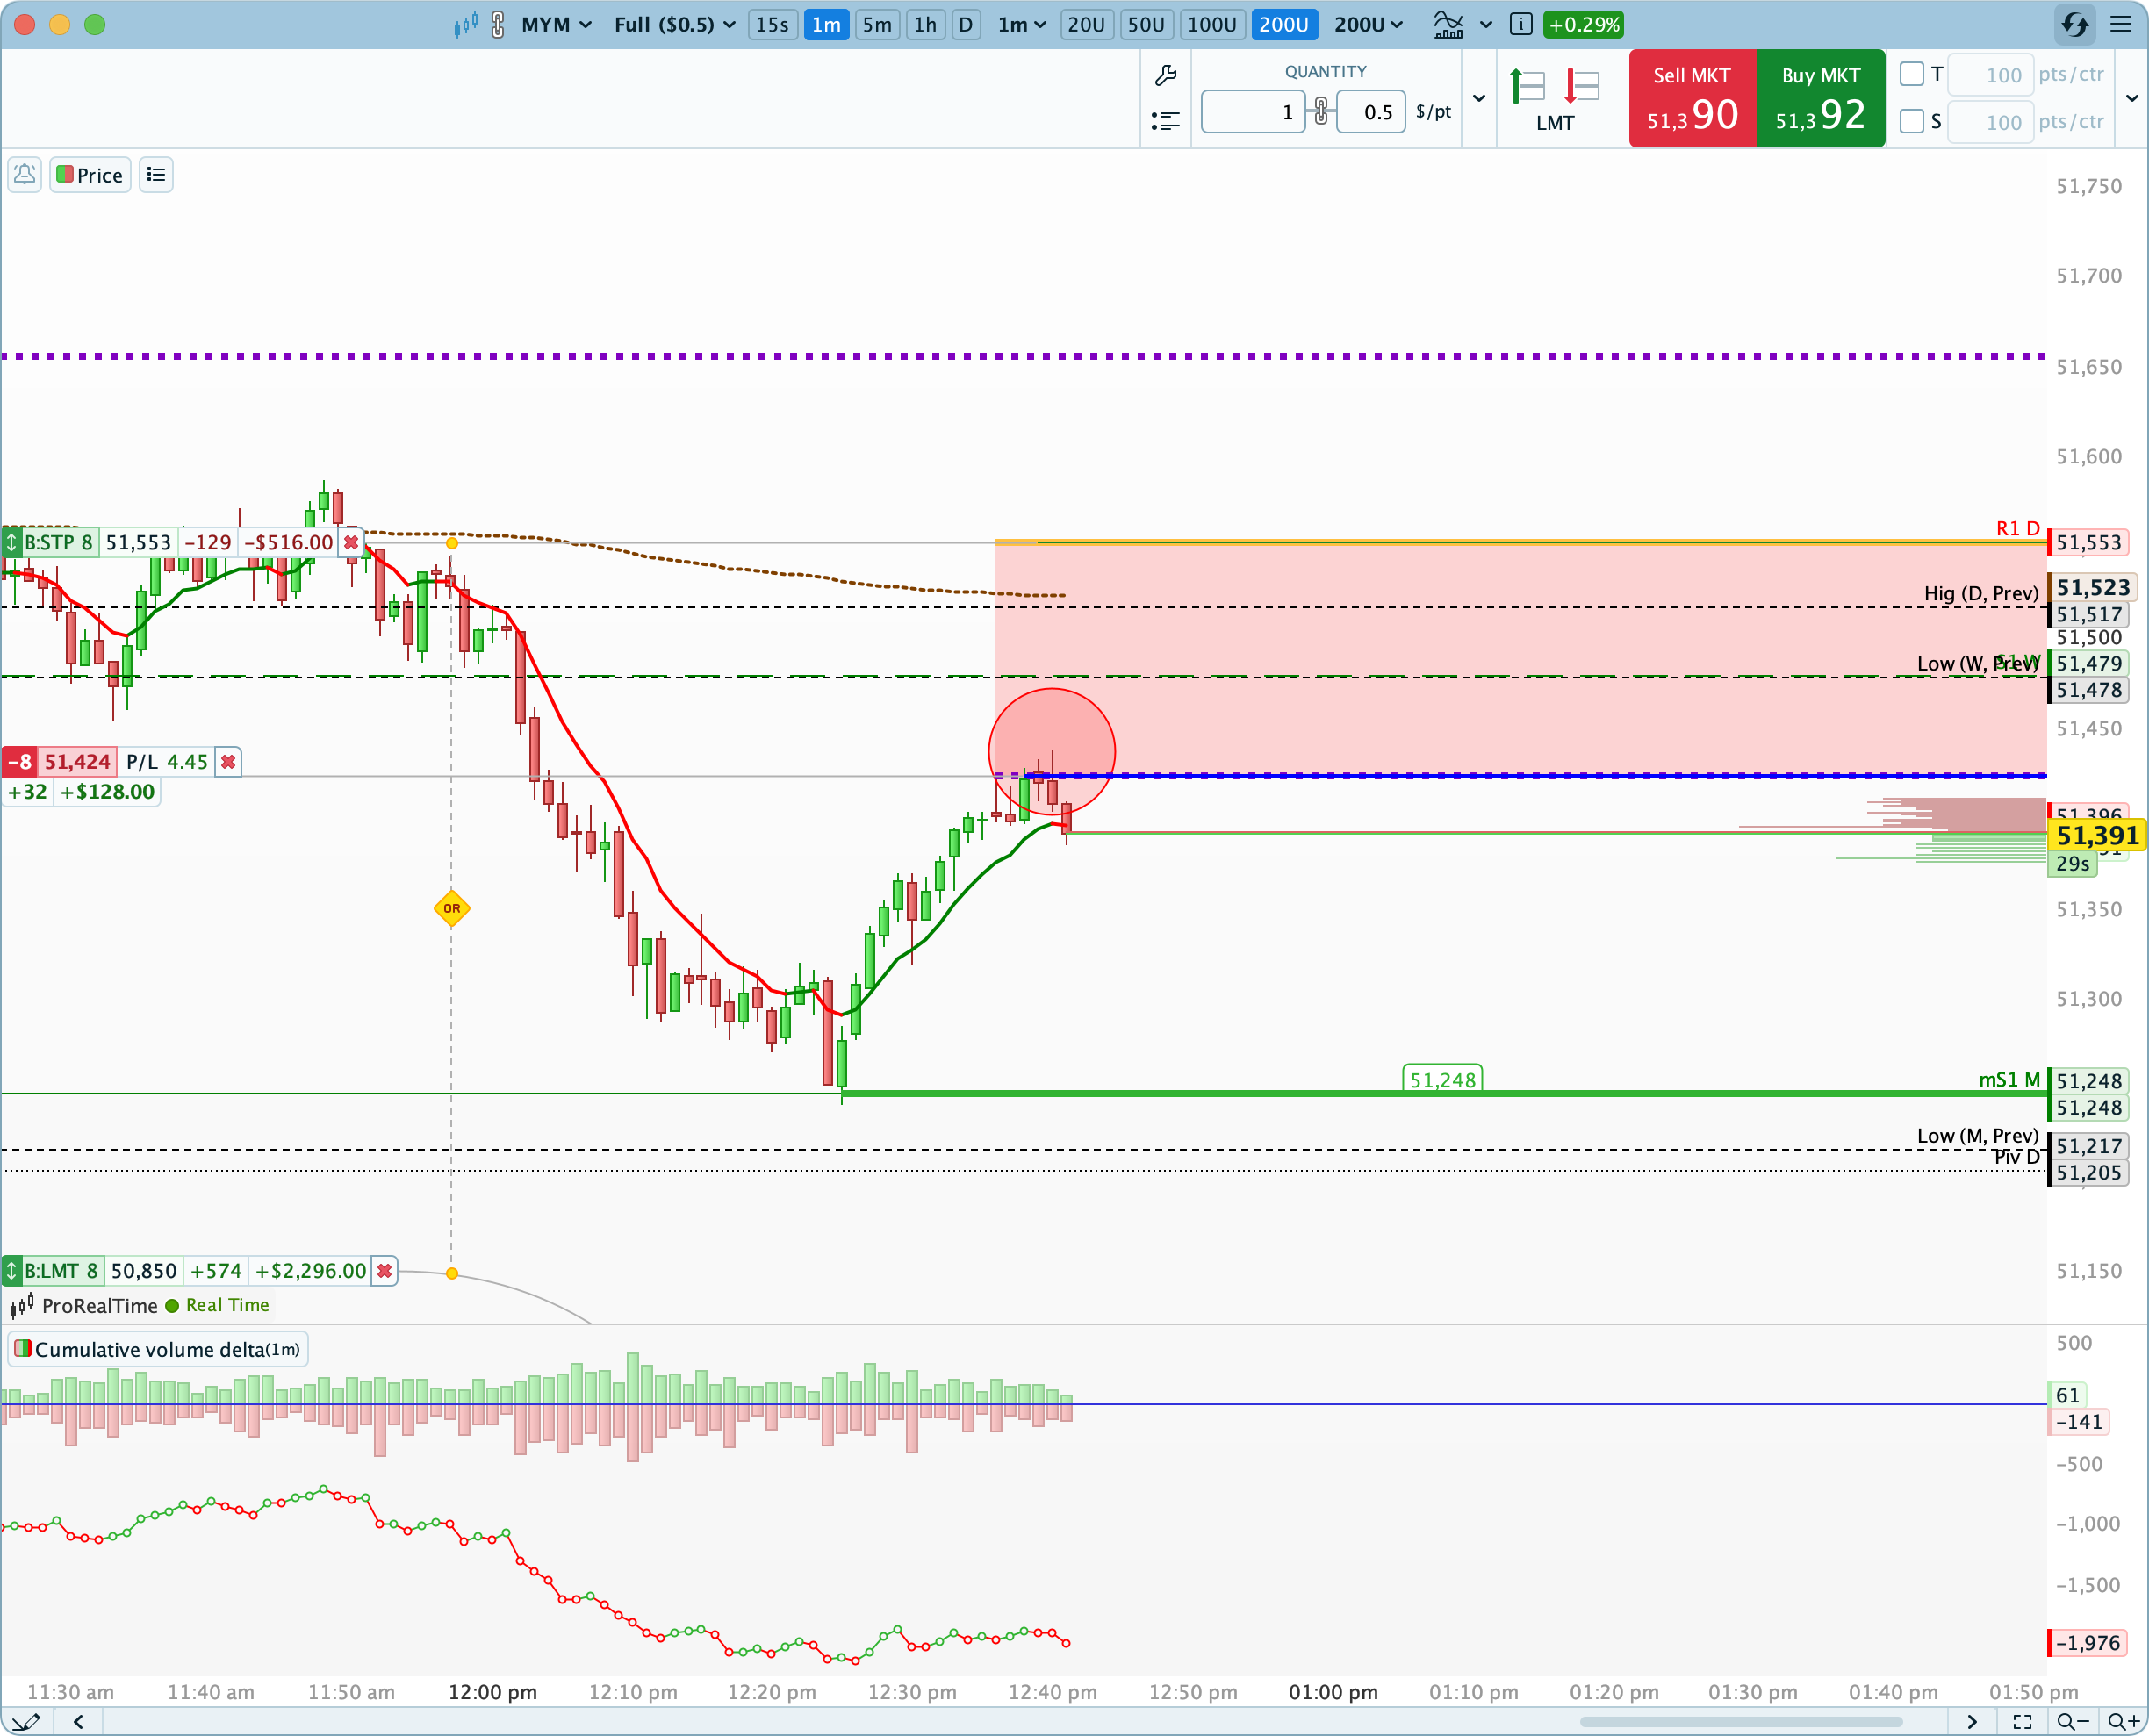
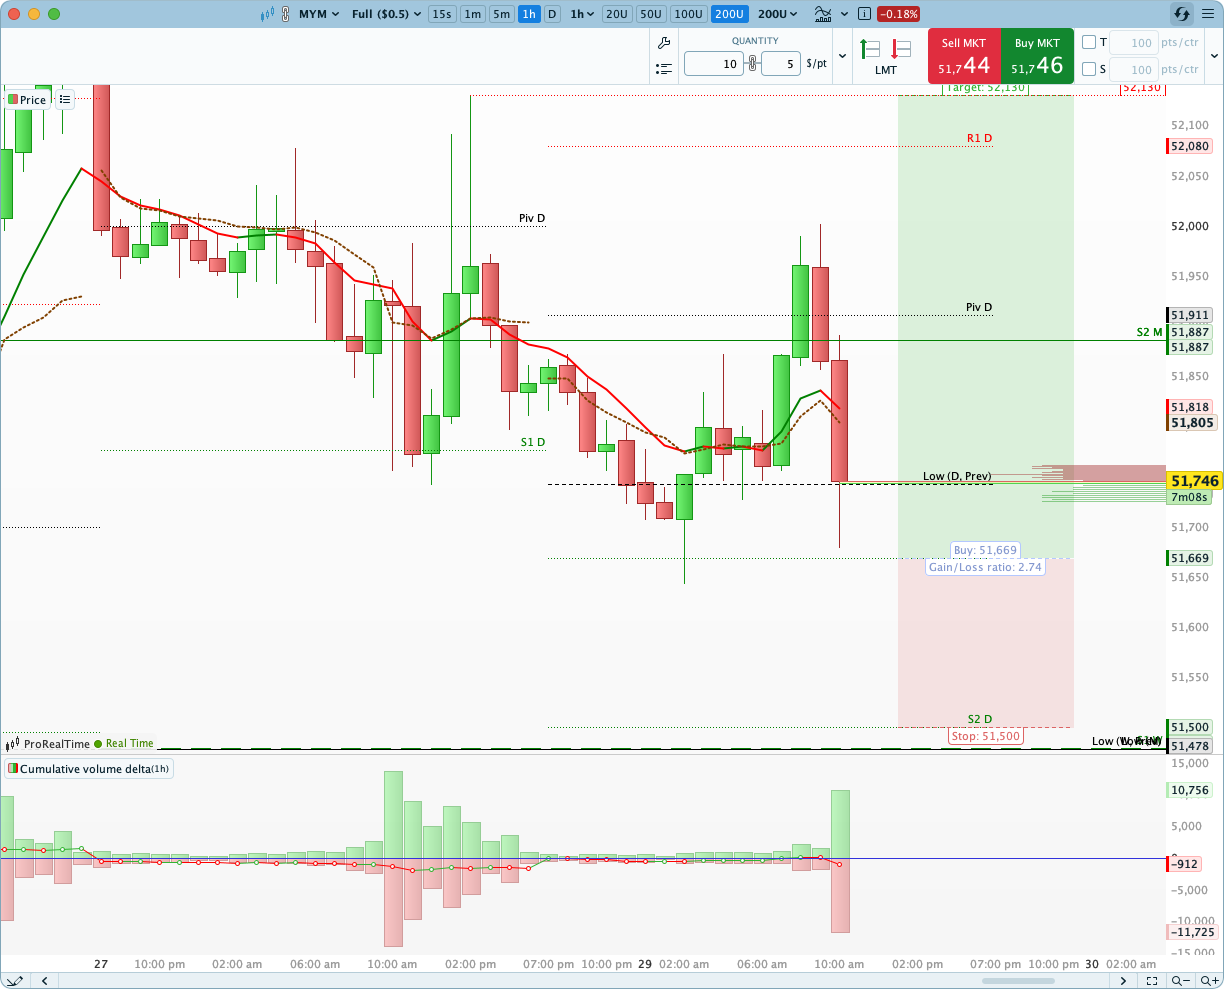
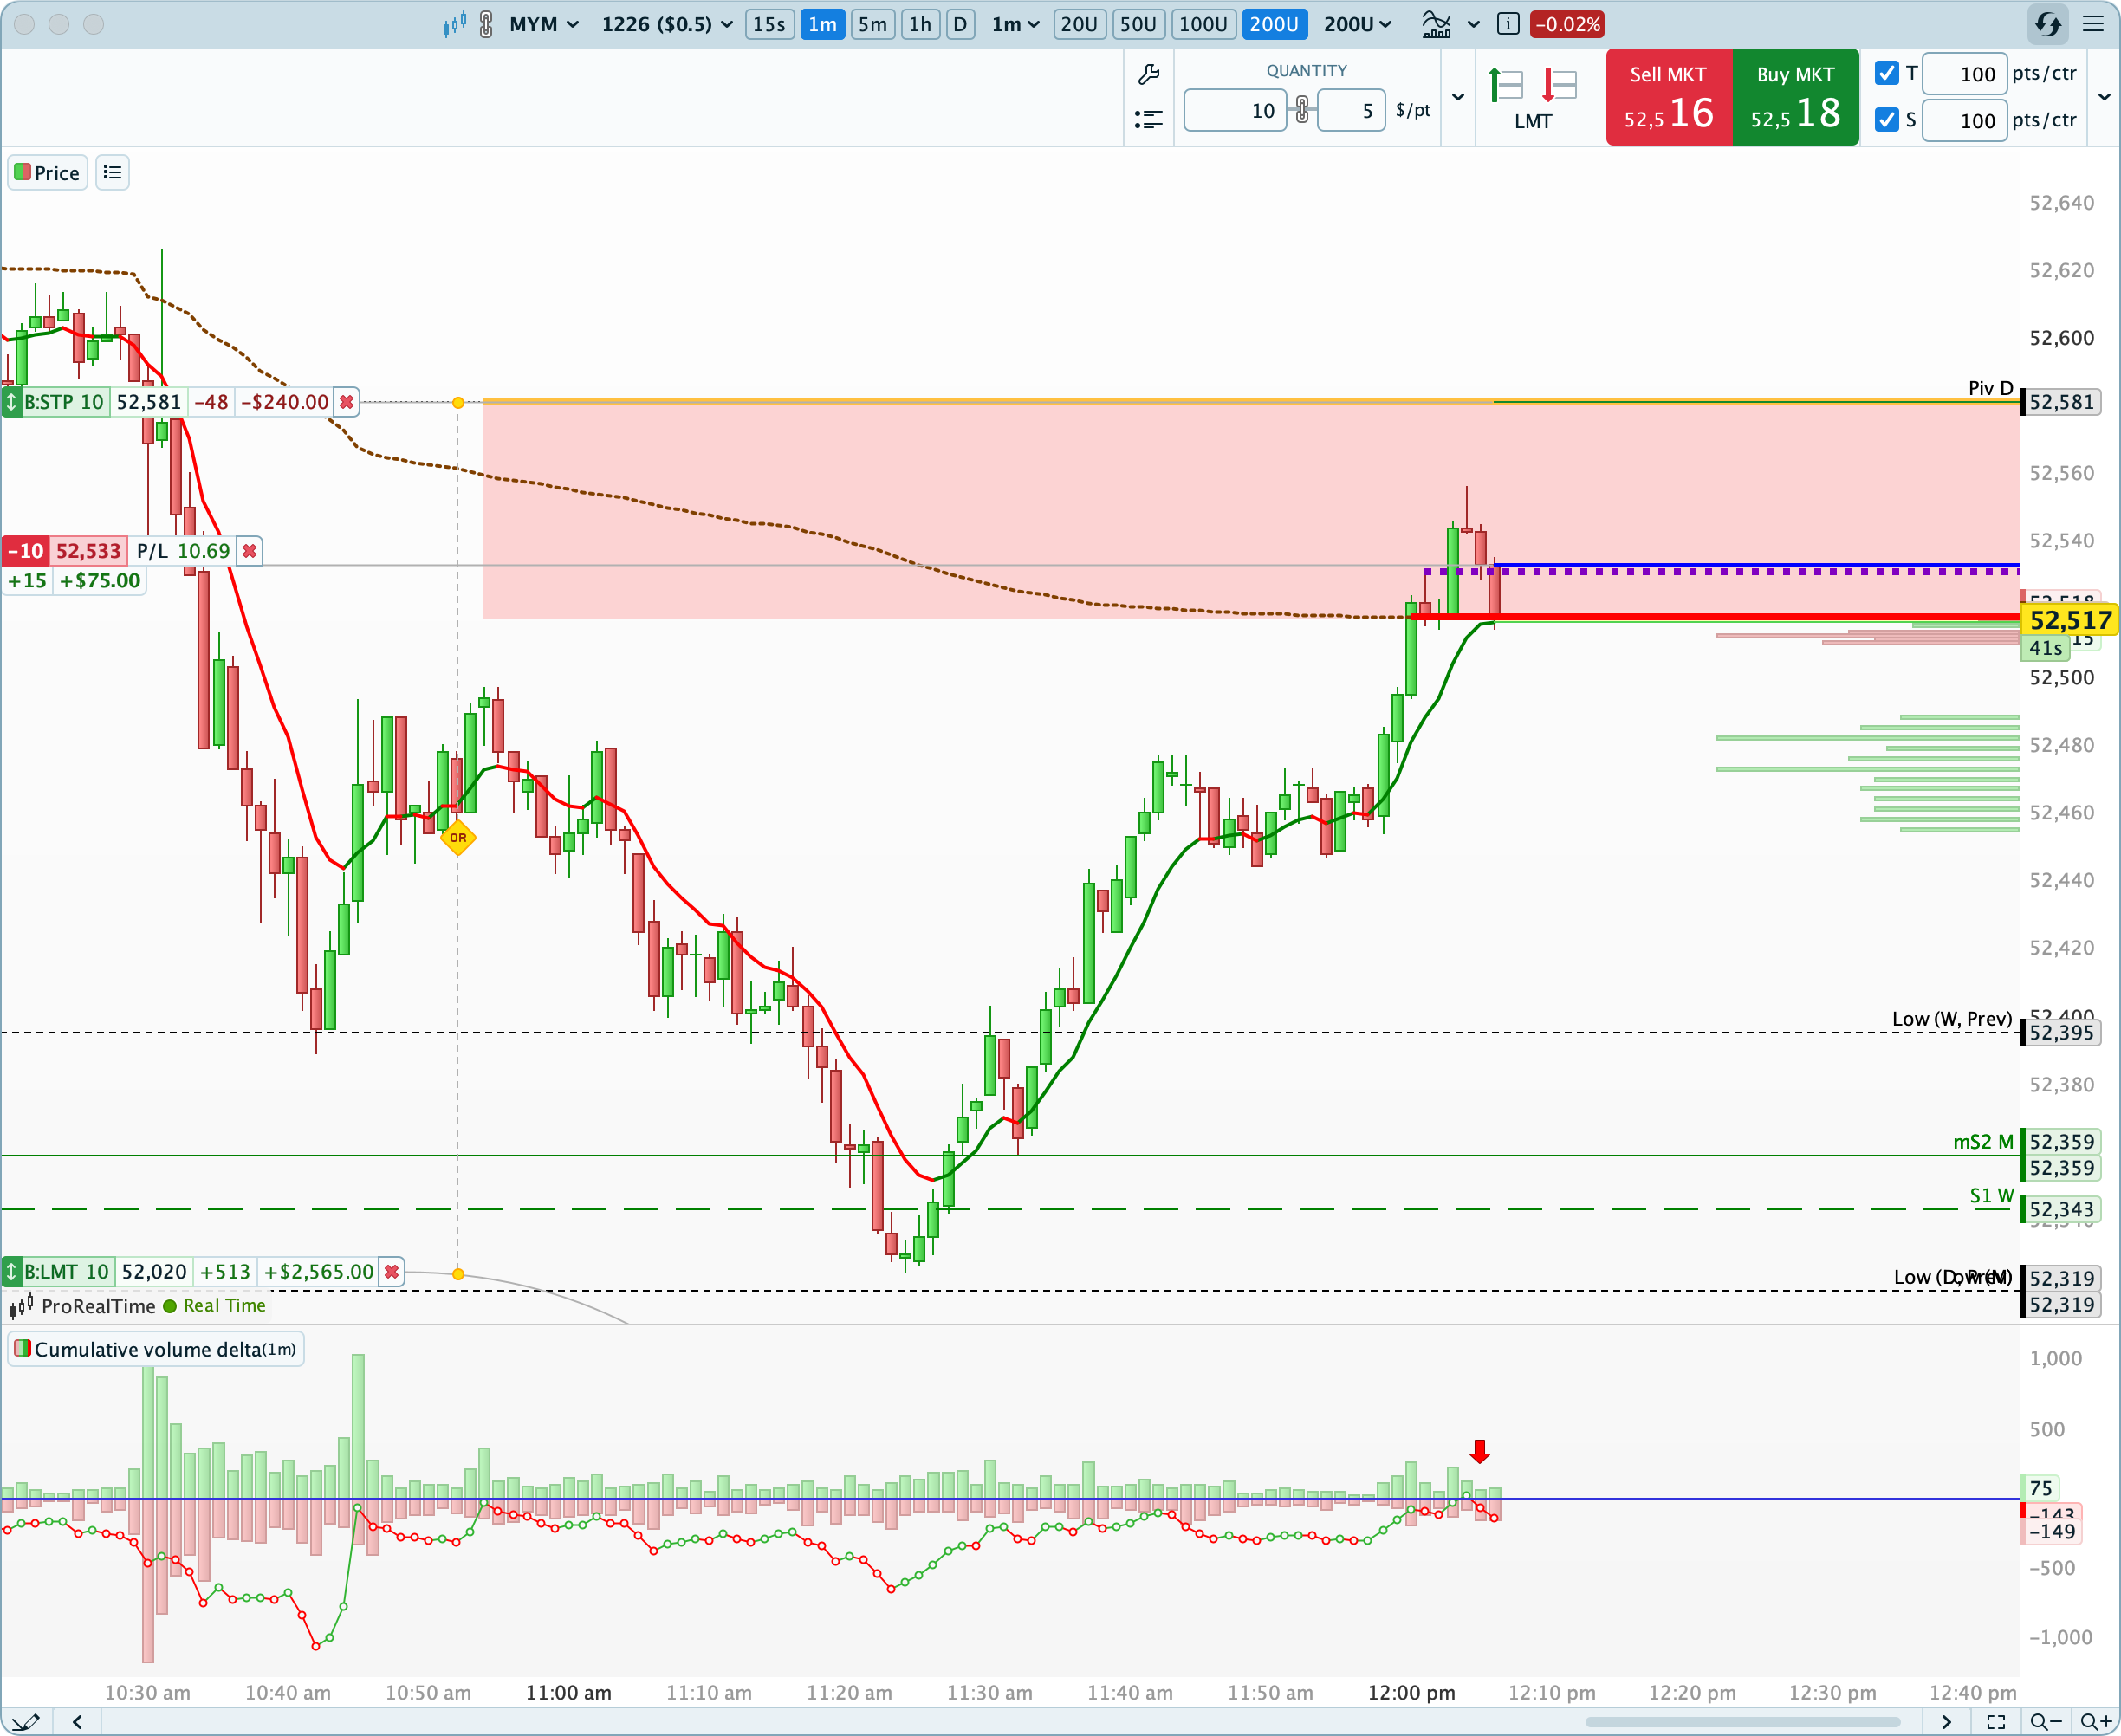
The break above the VWAP triggered a buying offensive that could well get trapped before reaching the daily pivot point. If that's the case, the market could then go hunt the buyers' stop-loss orders sitting below the 52025 support.
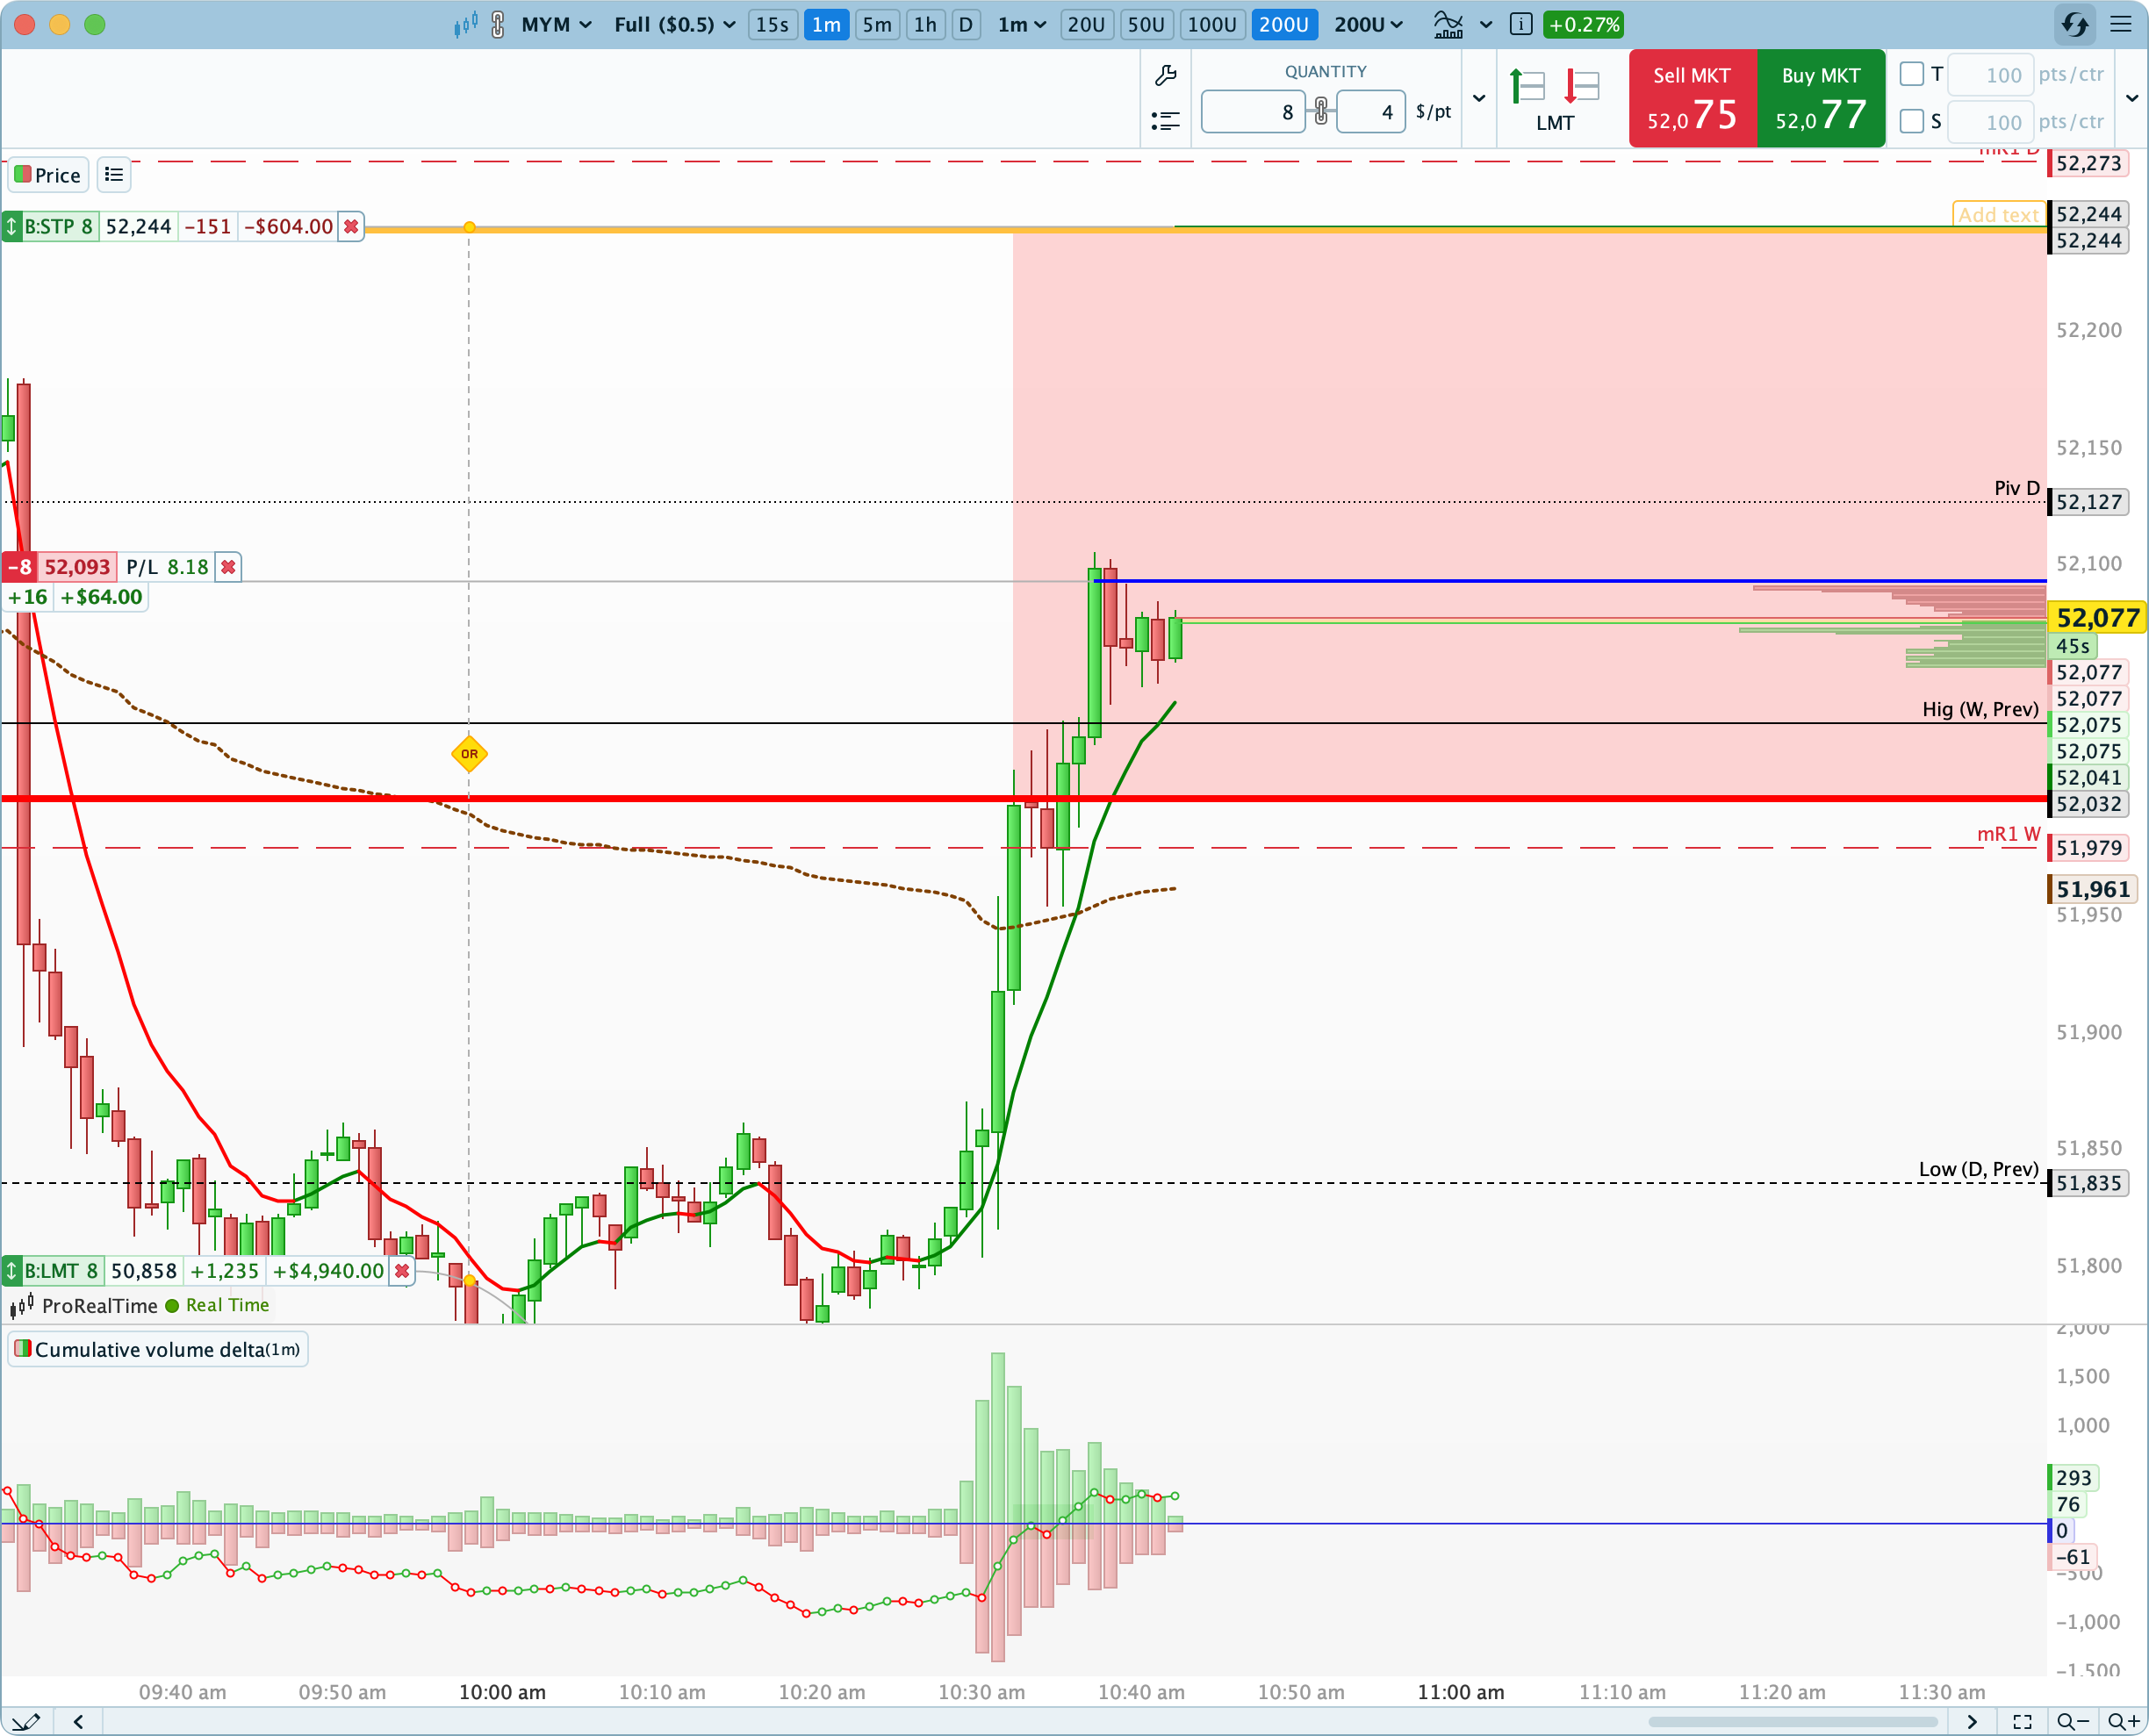
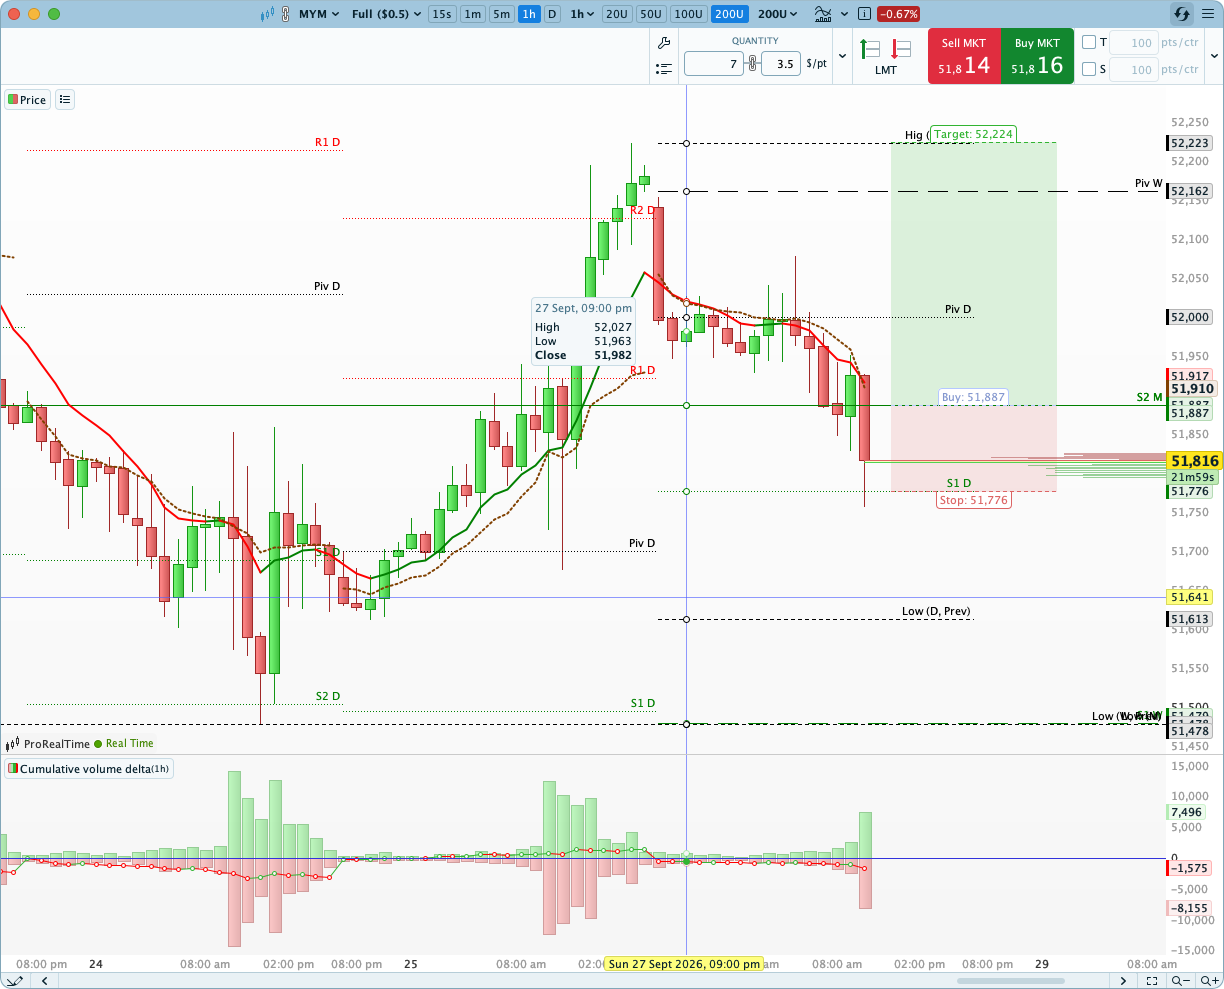
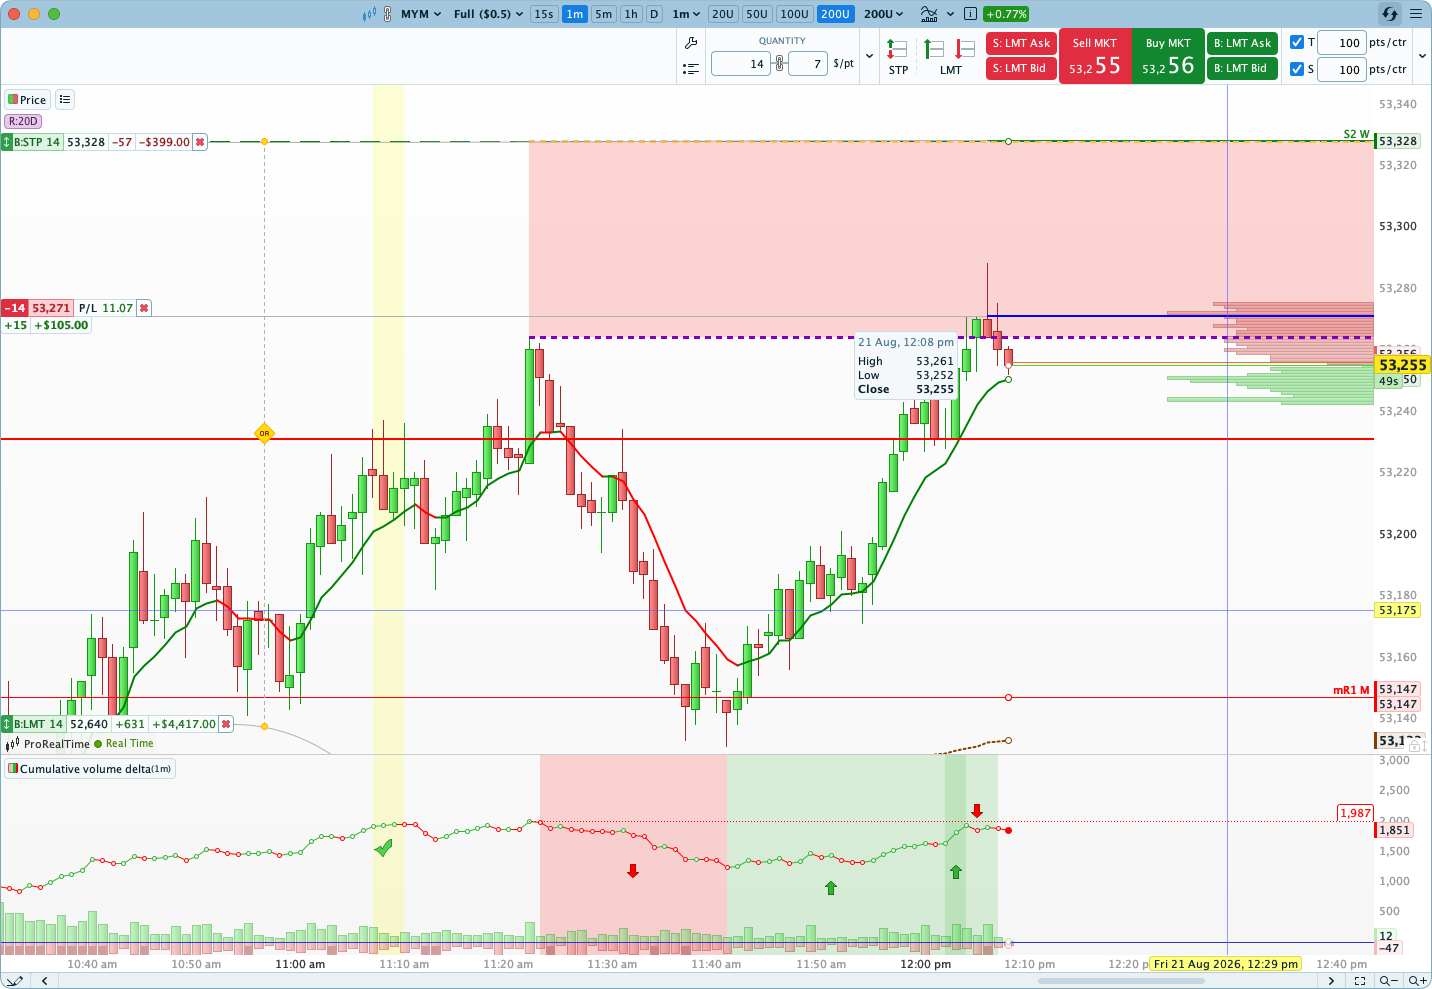
The break above the intraday high triggered a buying offensive, but the buyers failed to reach the weekly pivot point. So the market could go hunting for their stop-loss orders below the 52035 support.
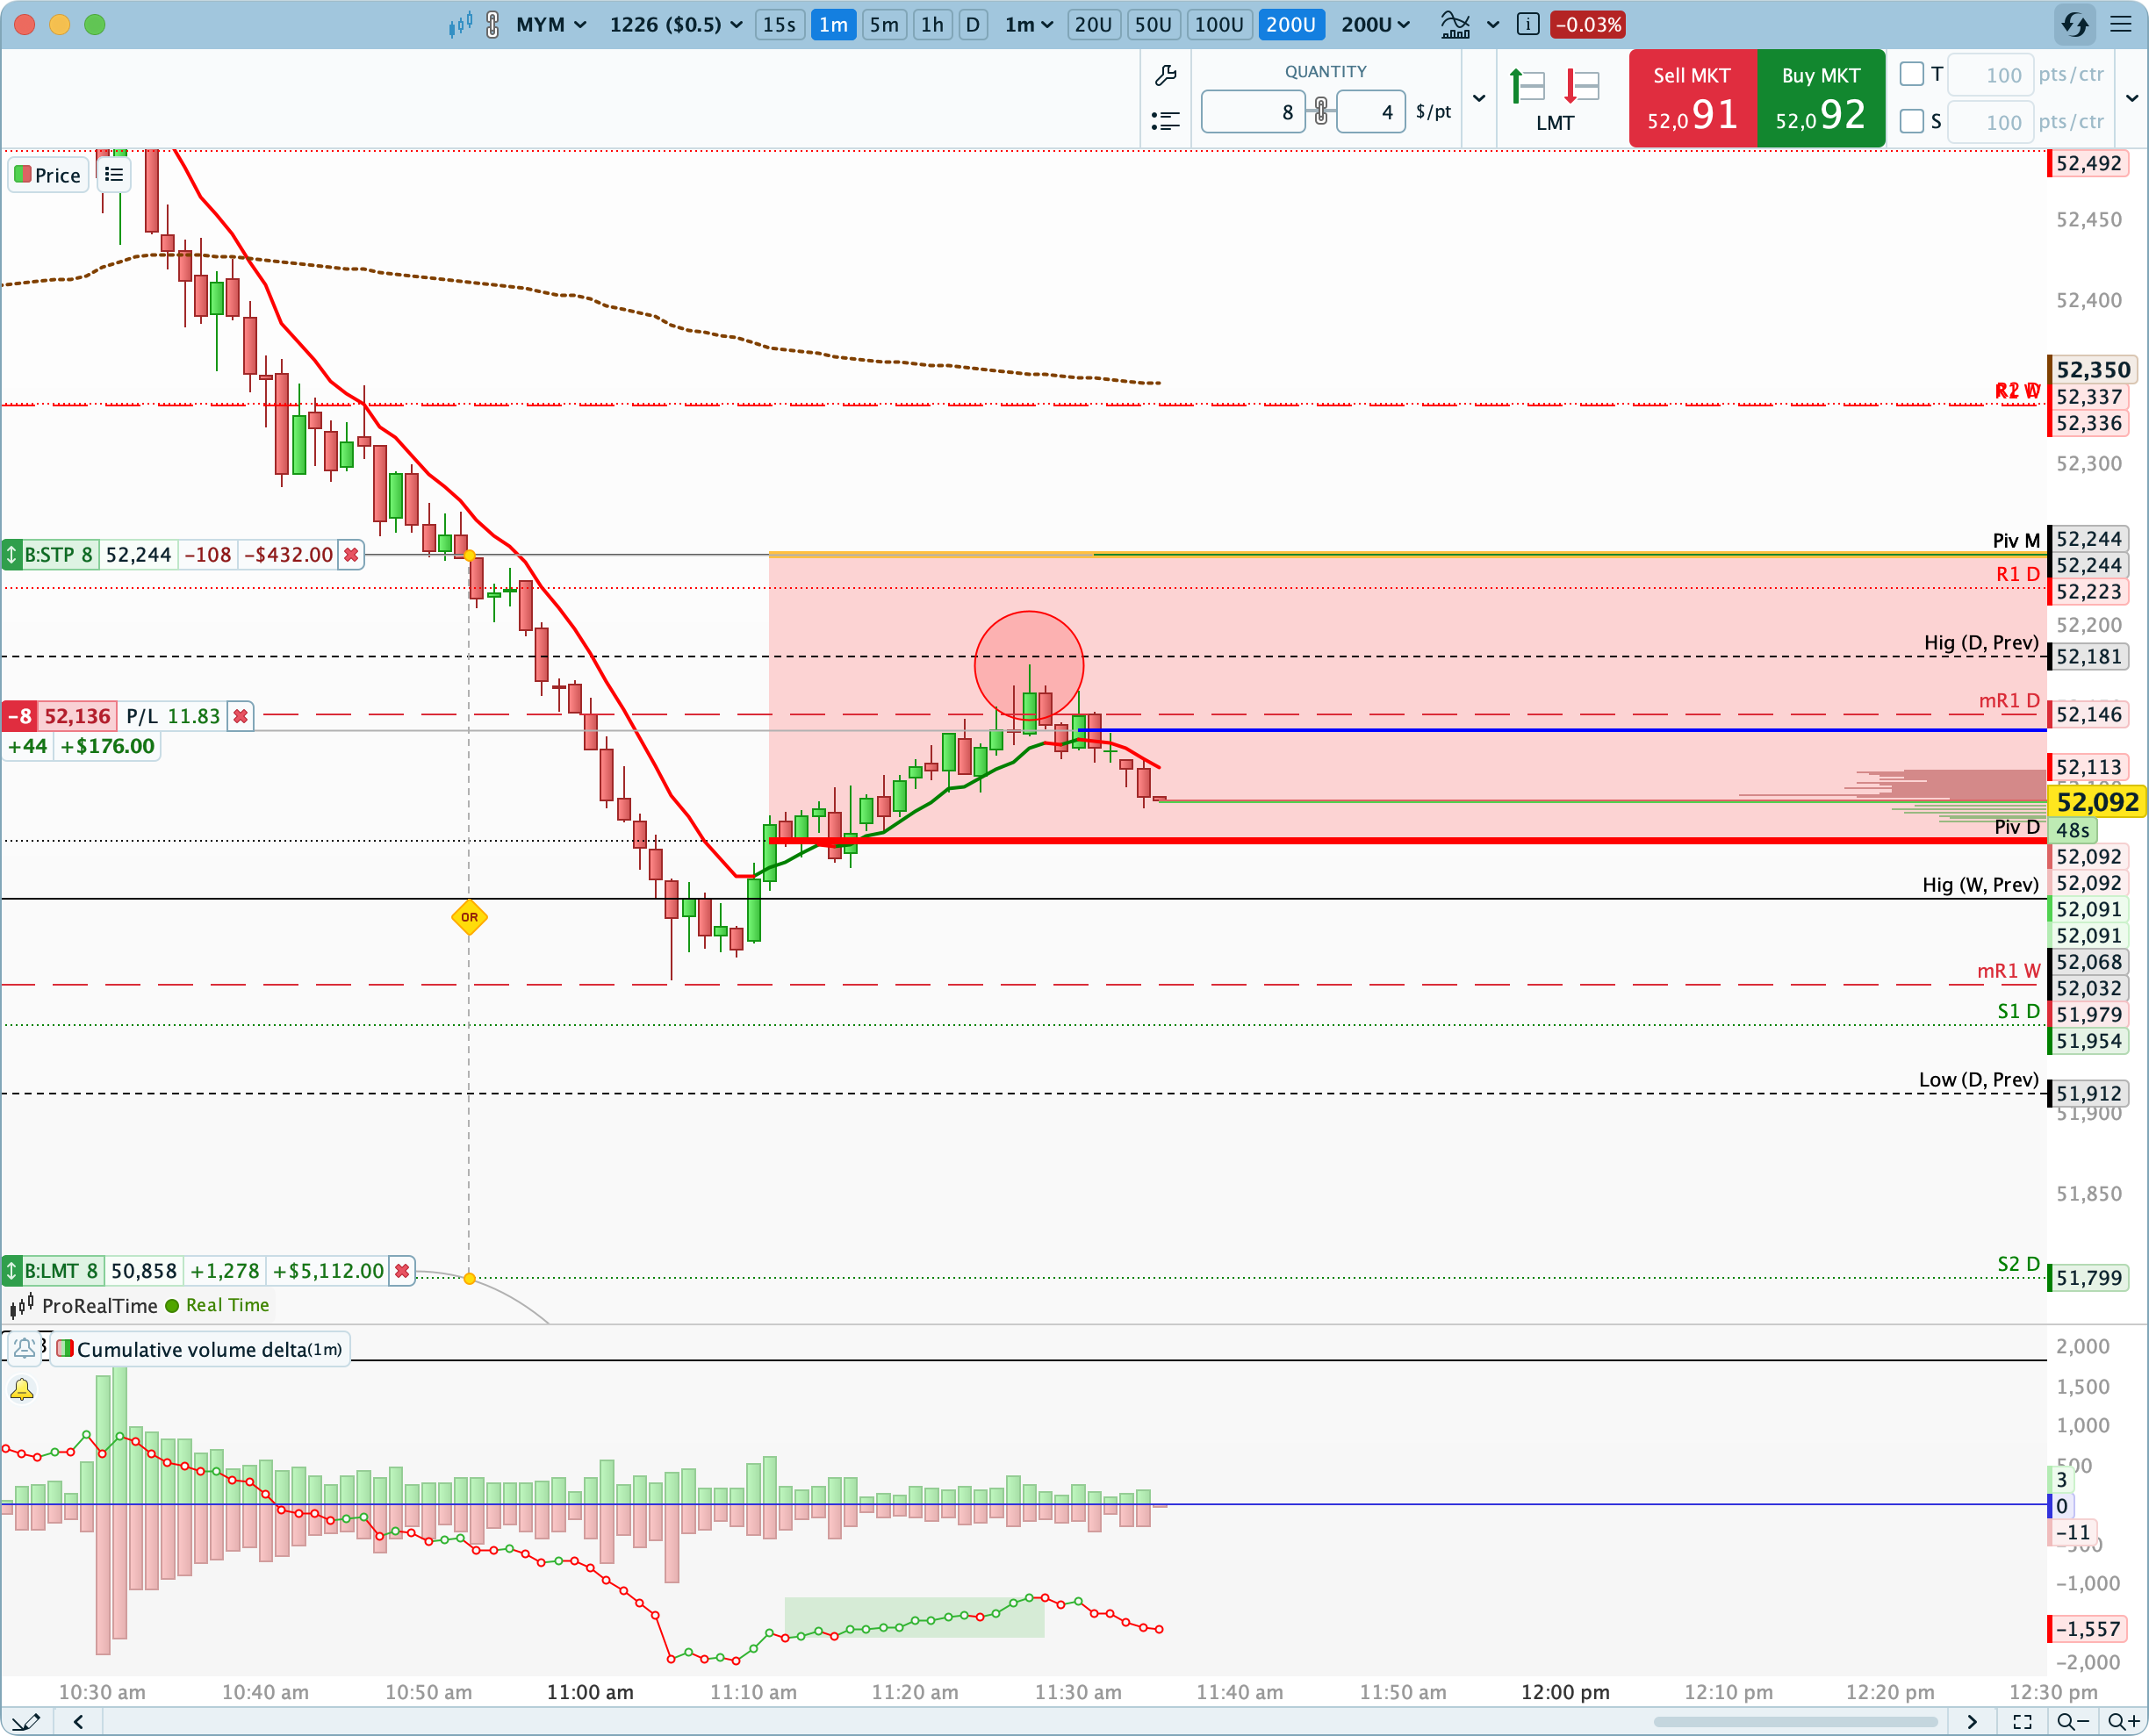
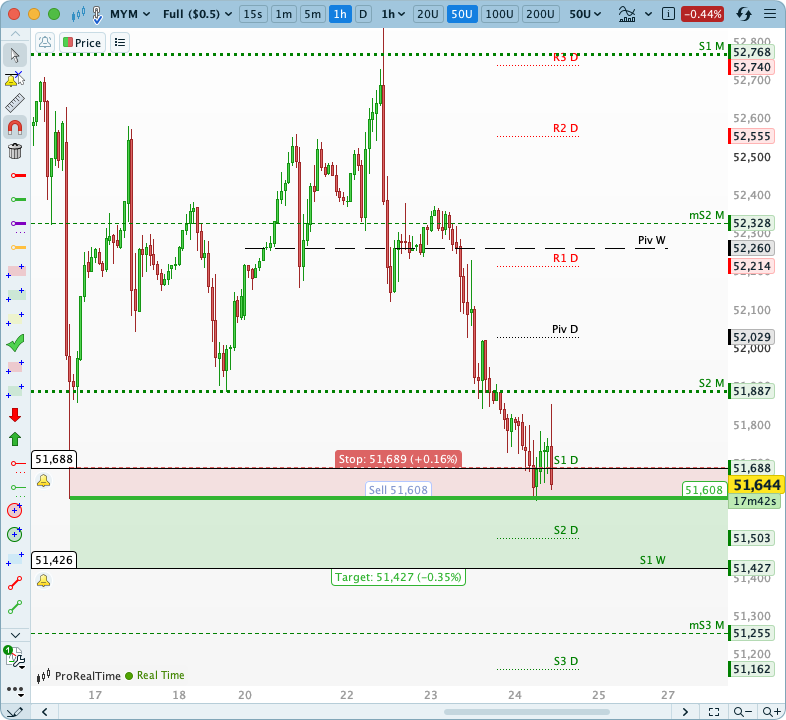
The break of the weekly support 1 triggered a buying offensive, but the buyers failed to reach the mS1M. The market could therefore resume its downtrend toward the monthly support 1.
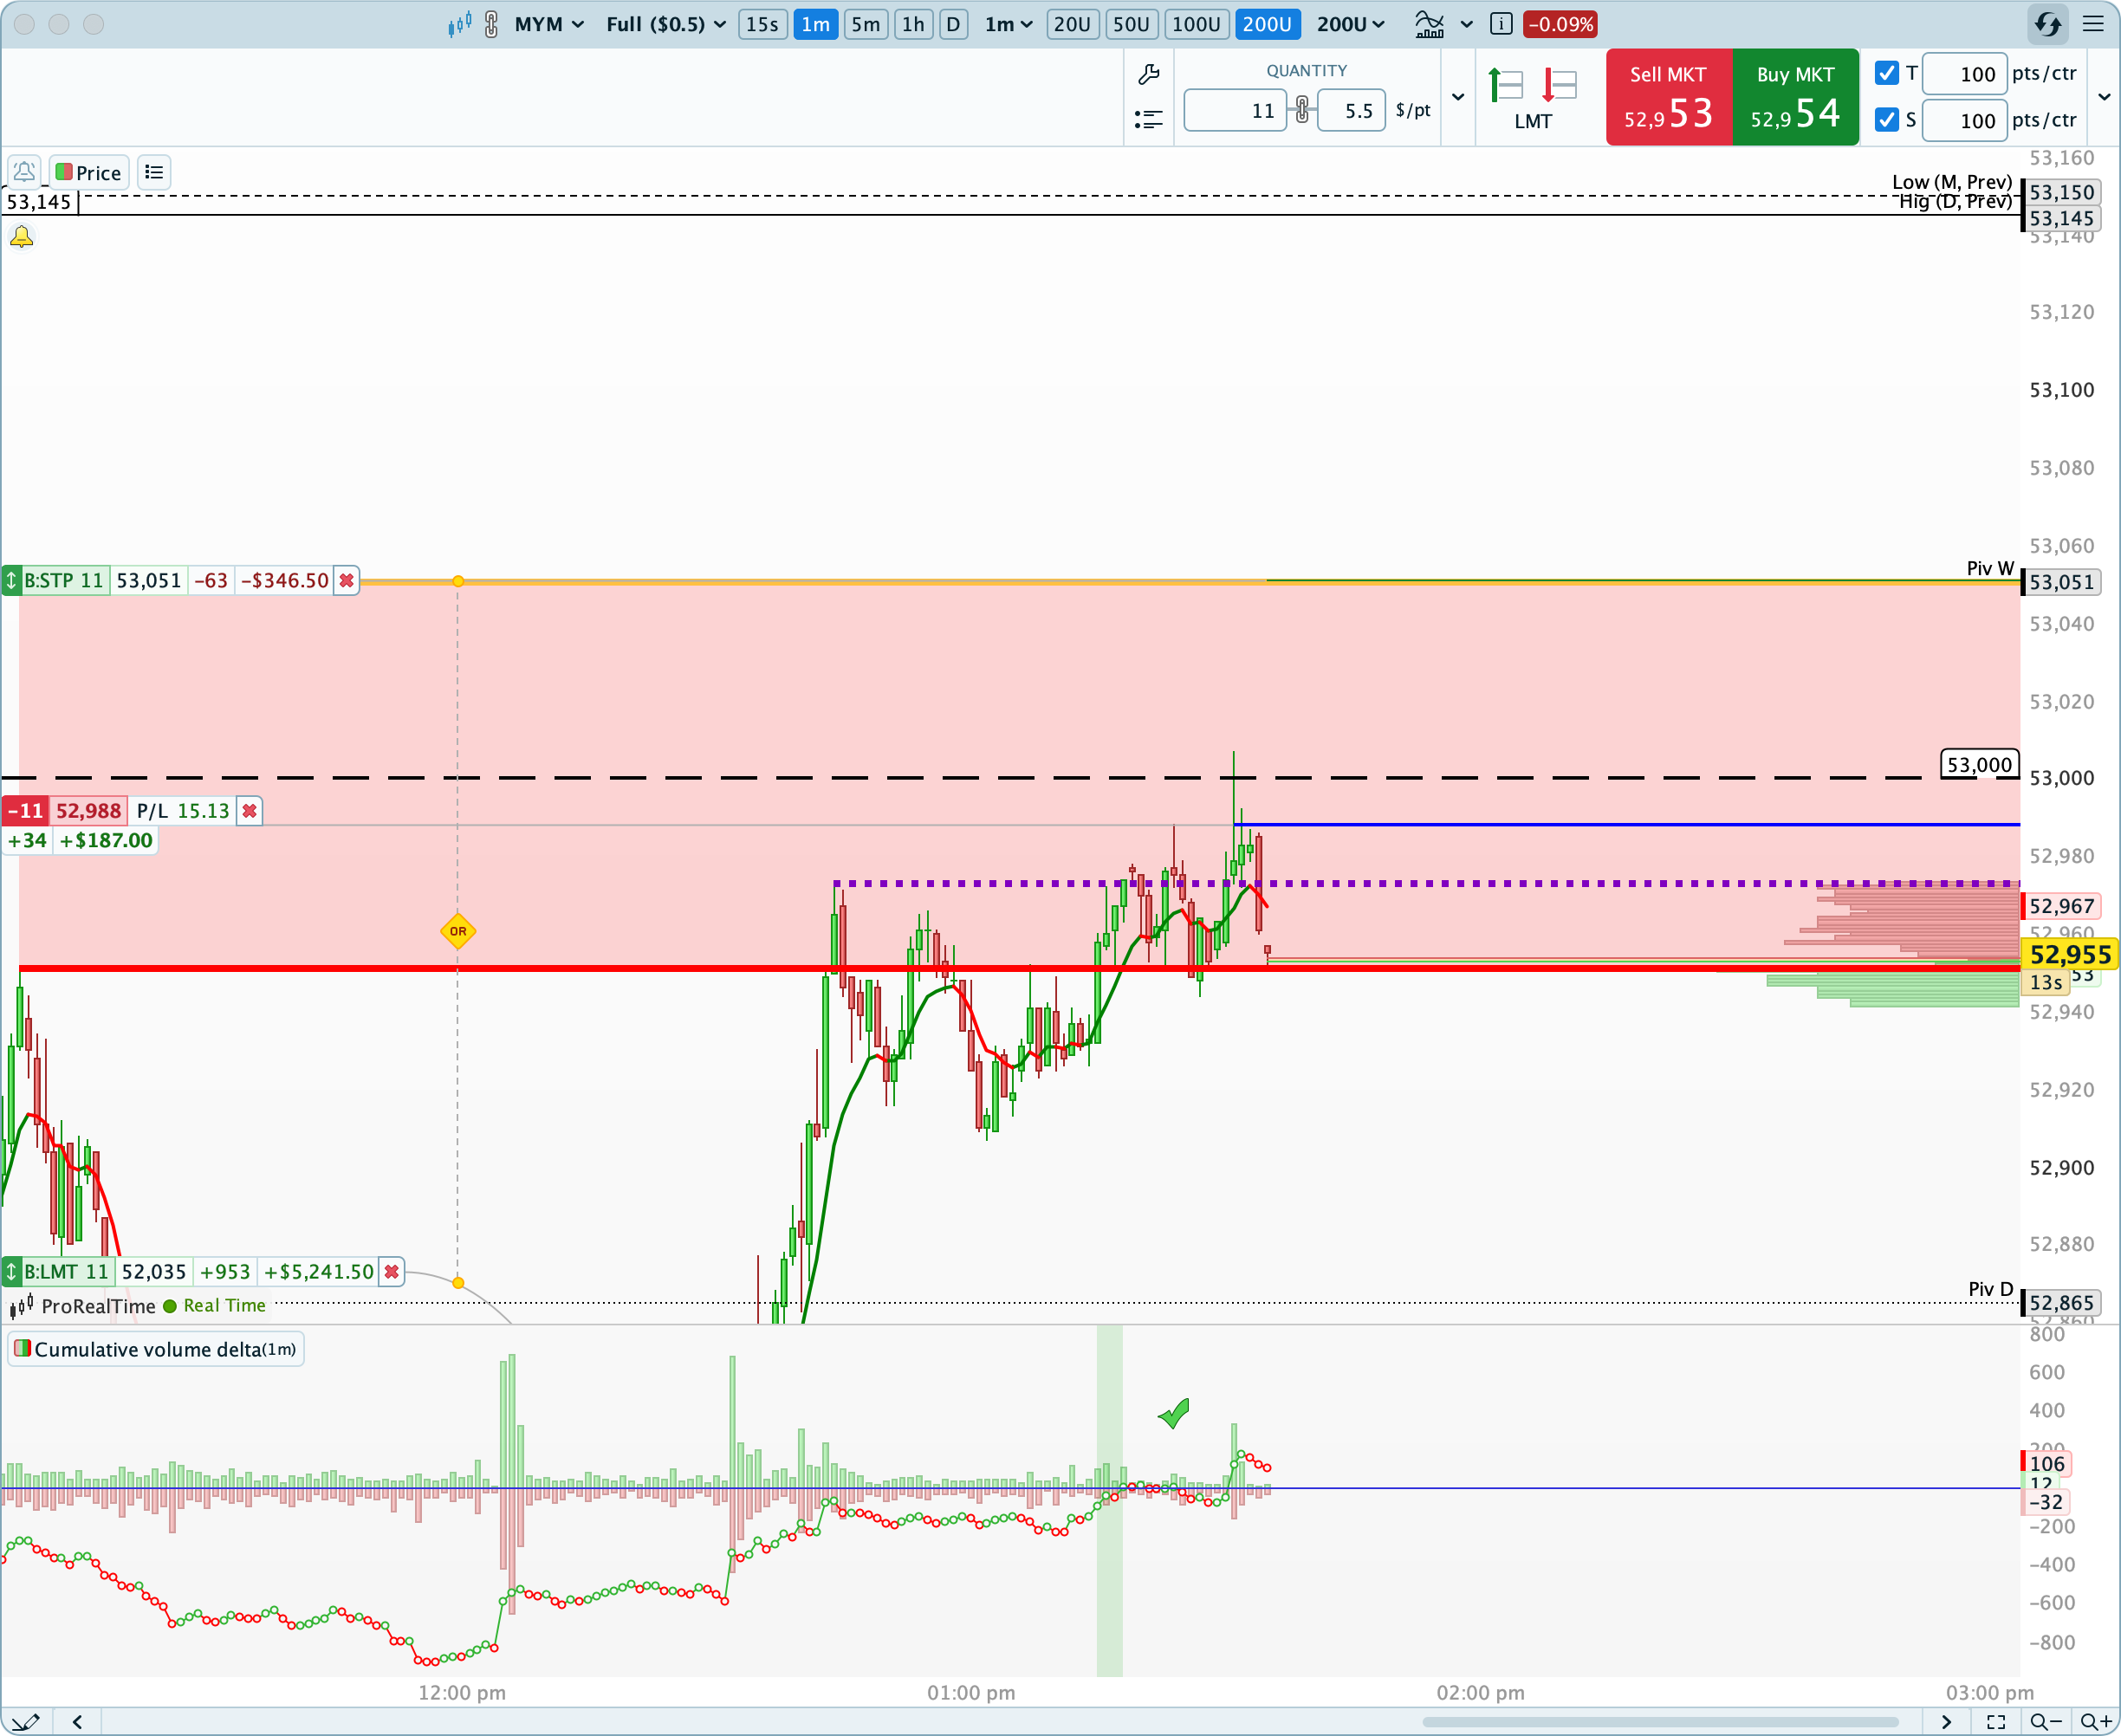
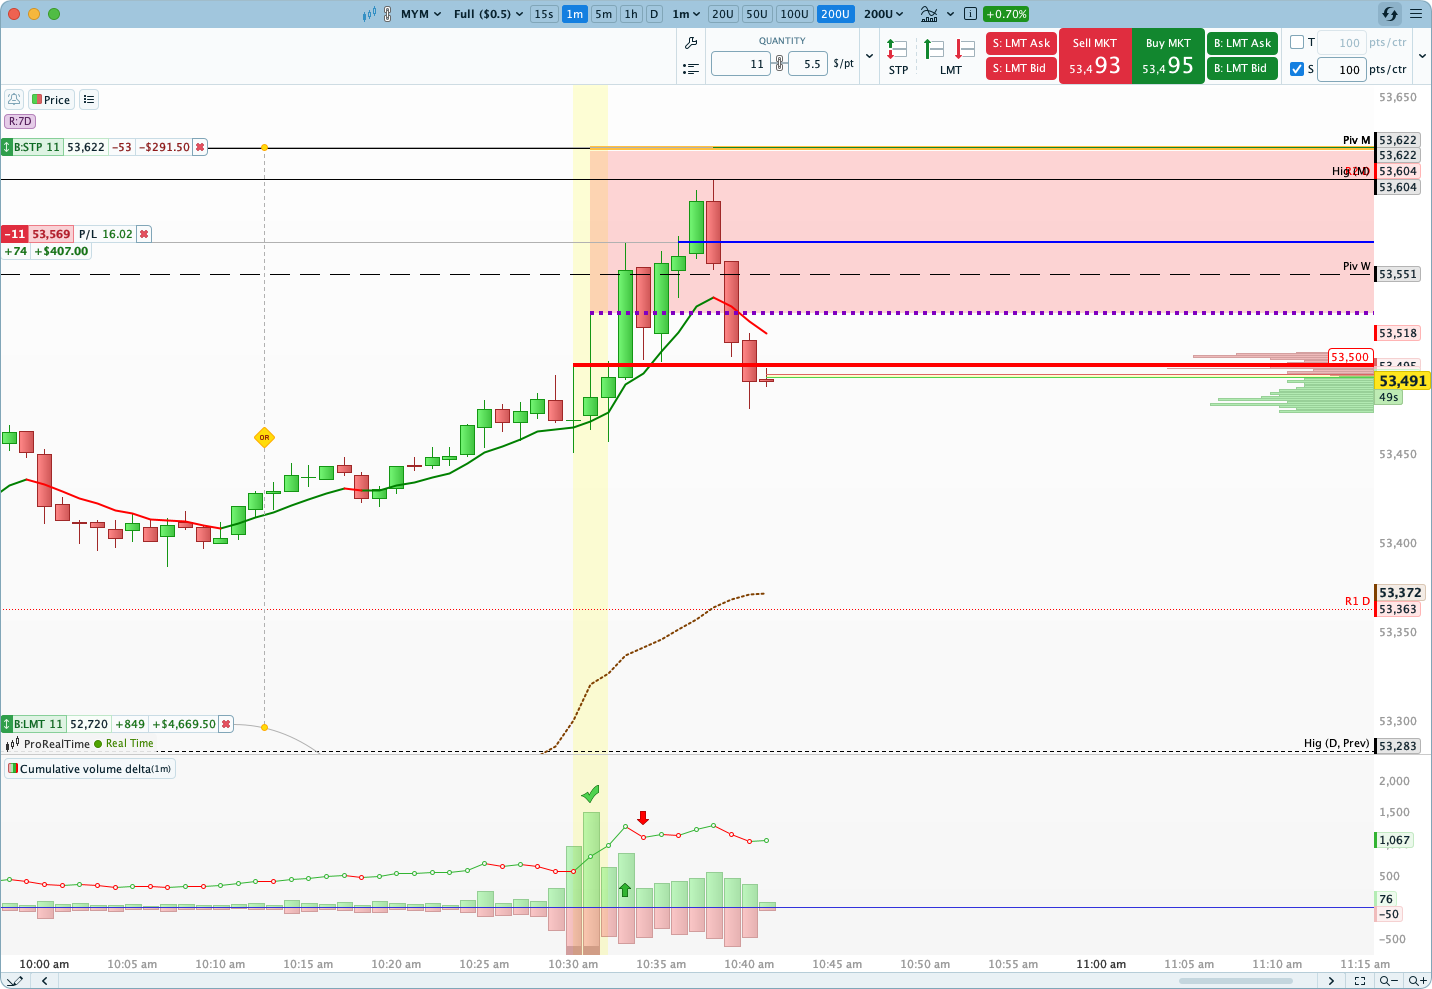
The break above the symbolic 53500-point level triggered a buying offensive, but the buyers failed to reach the monthly pivot point. The market could therefore go hunting for their stop-loss orders below the 52720-point support.
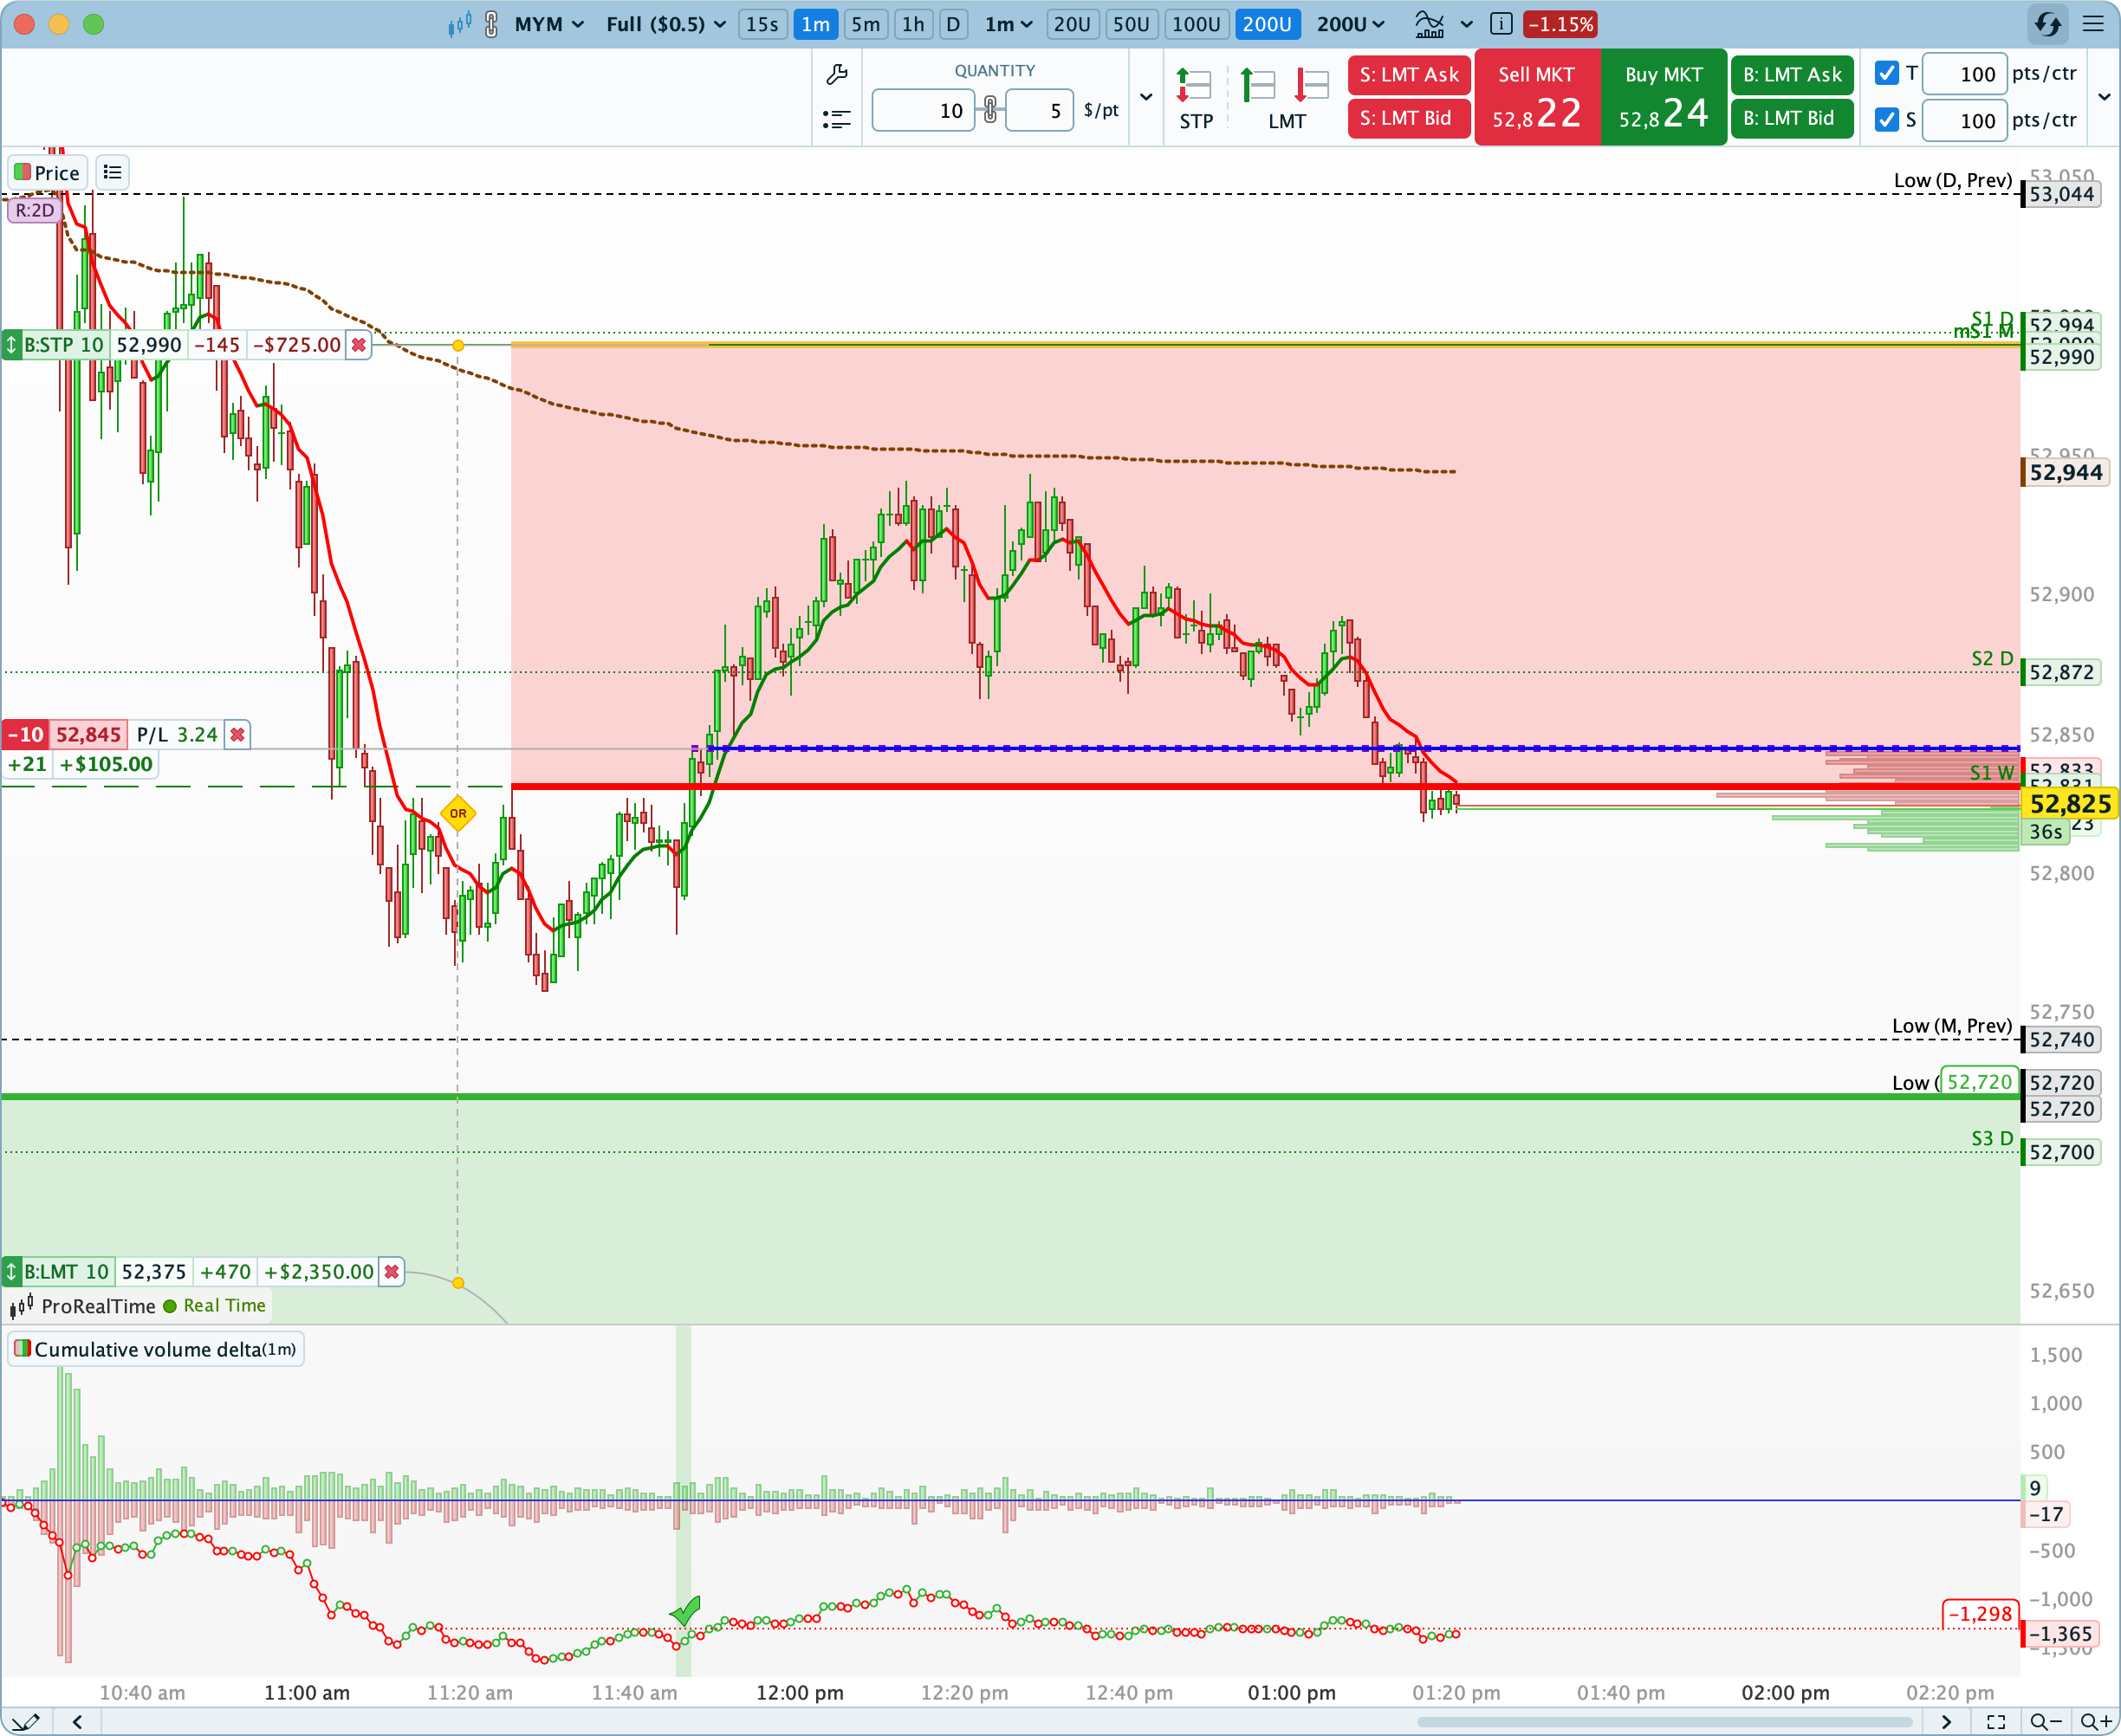
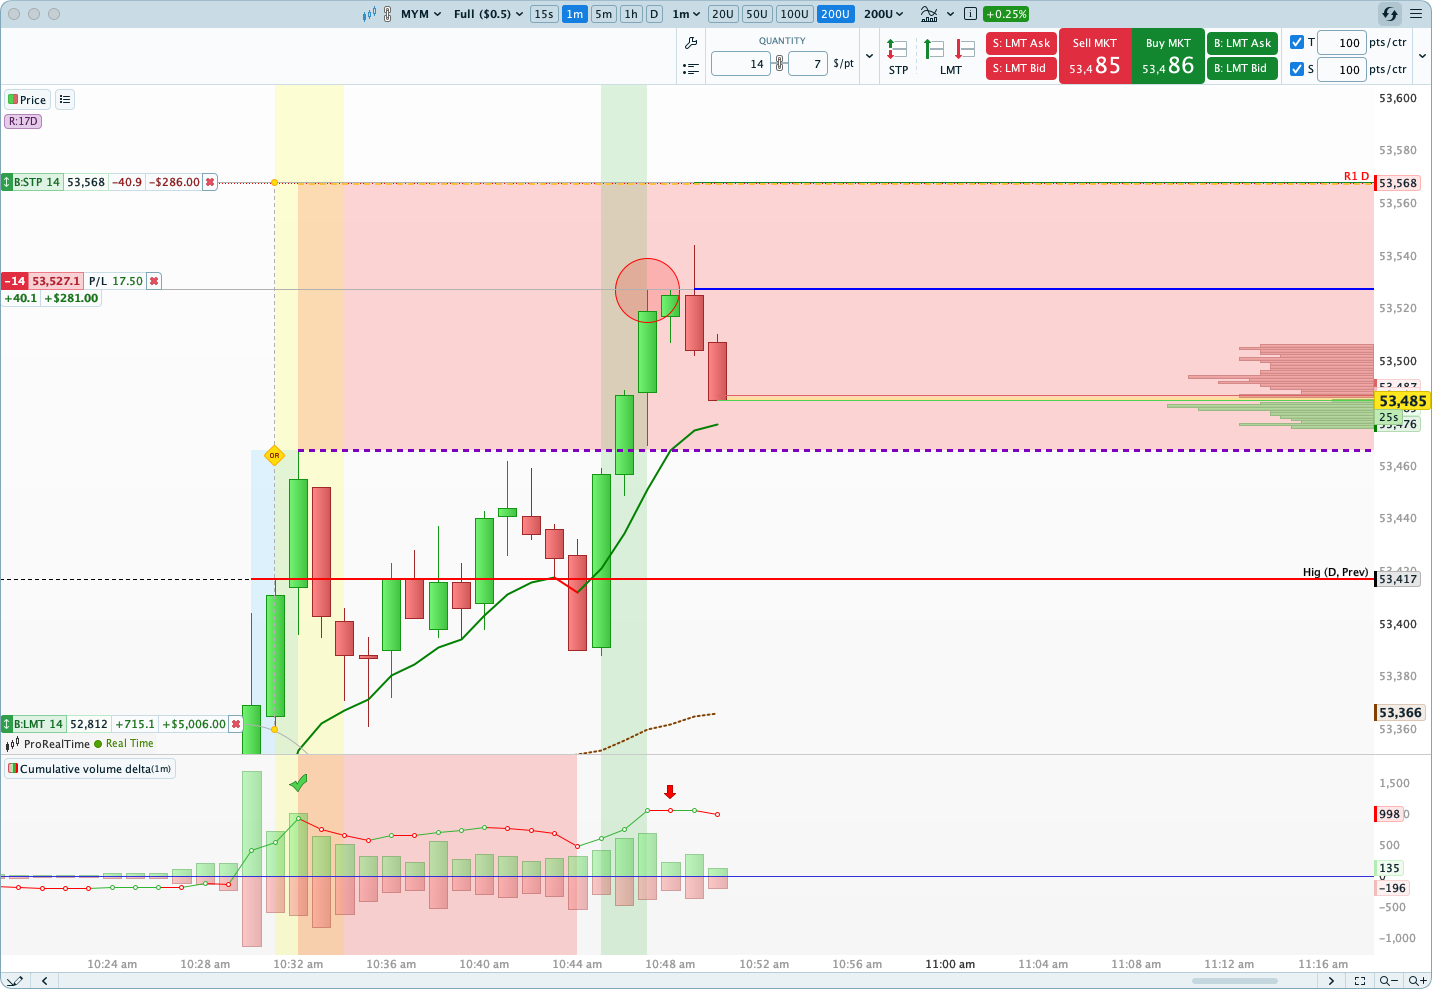
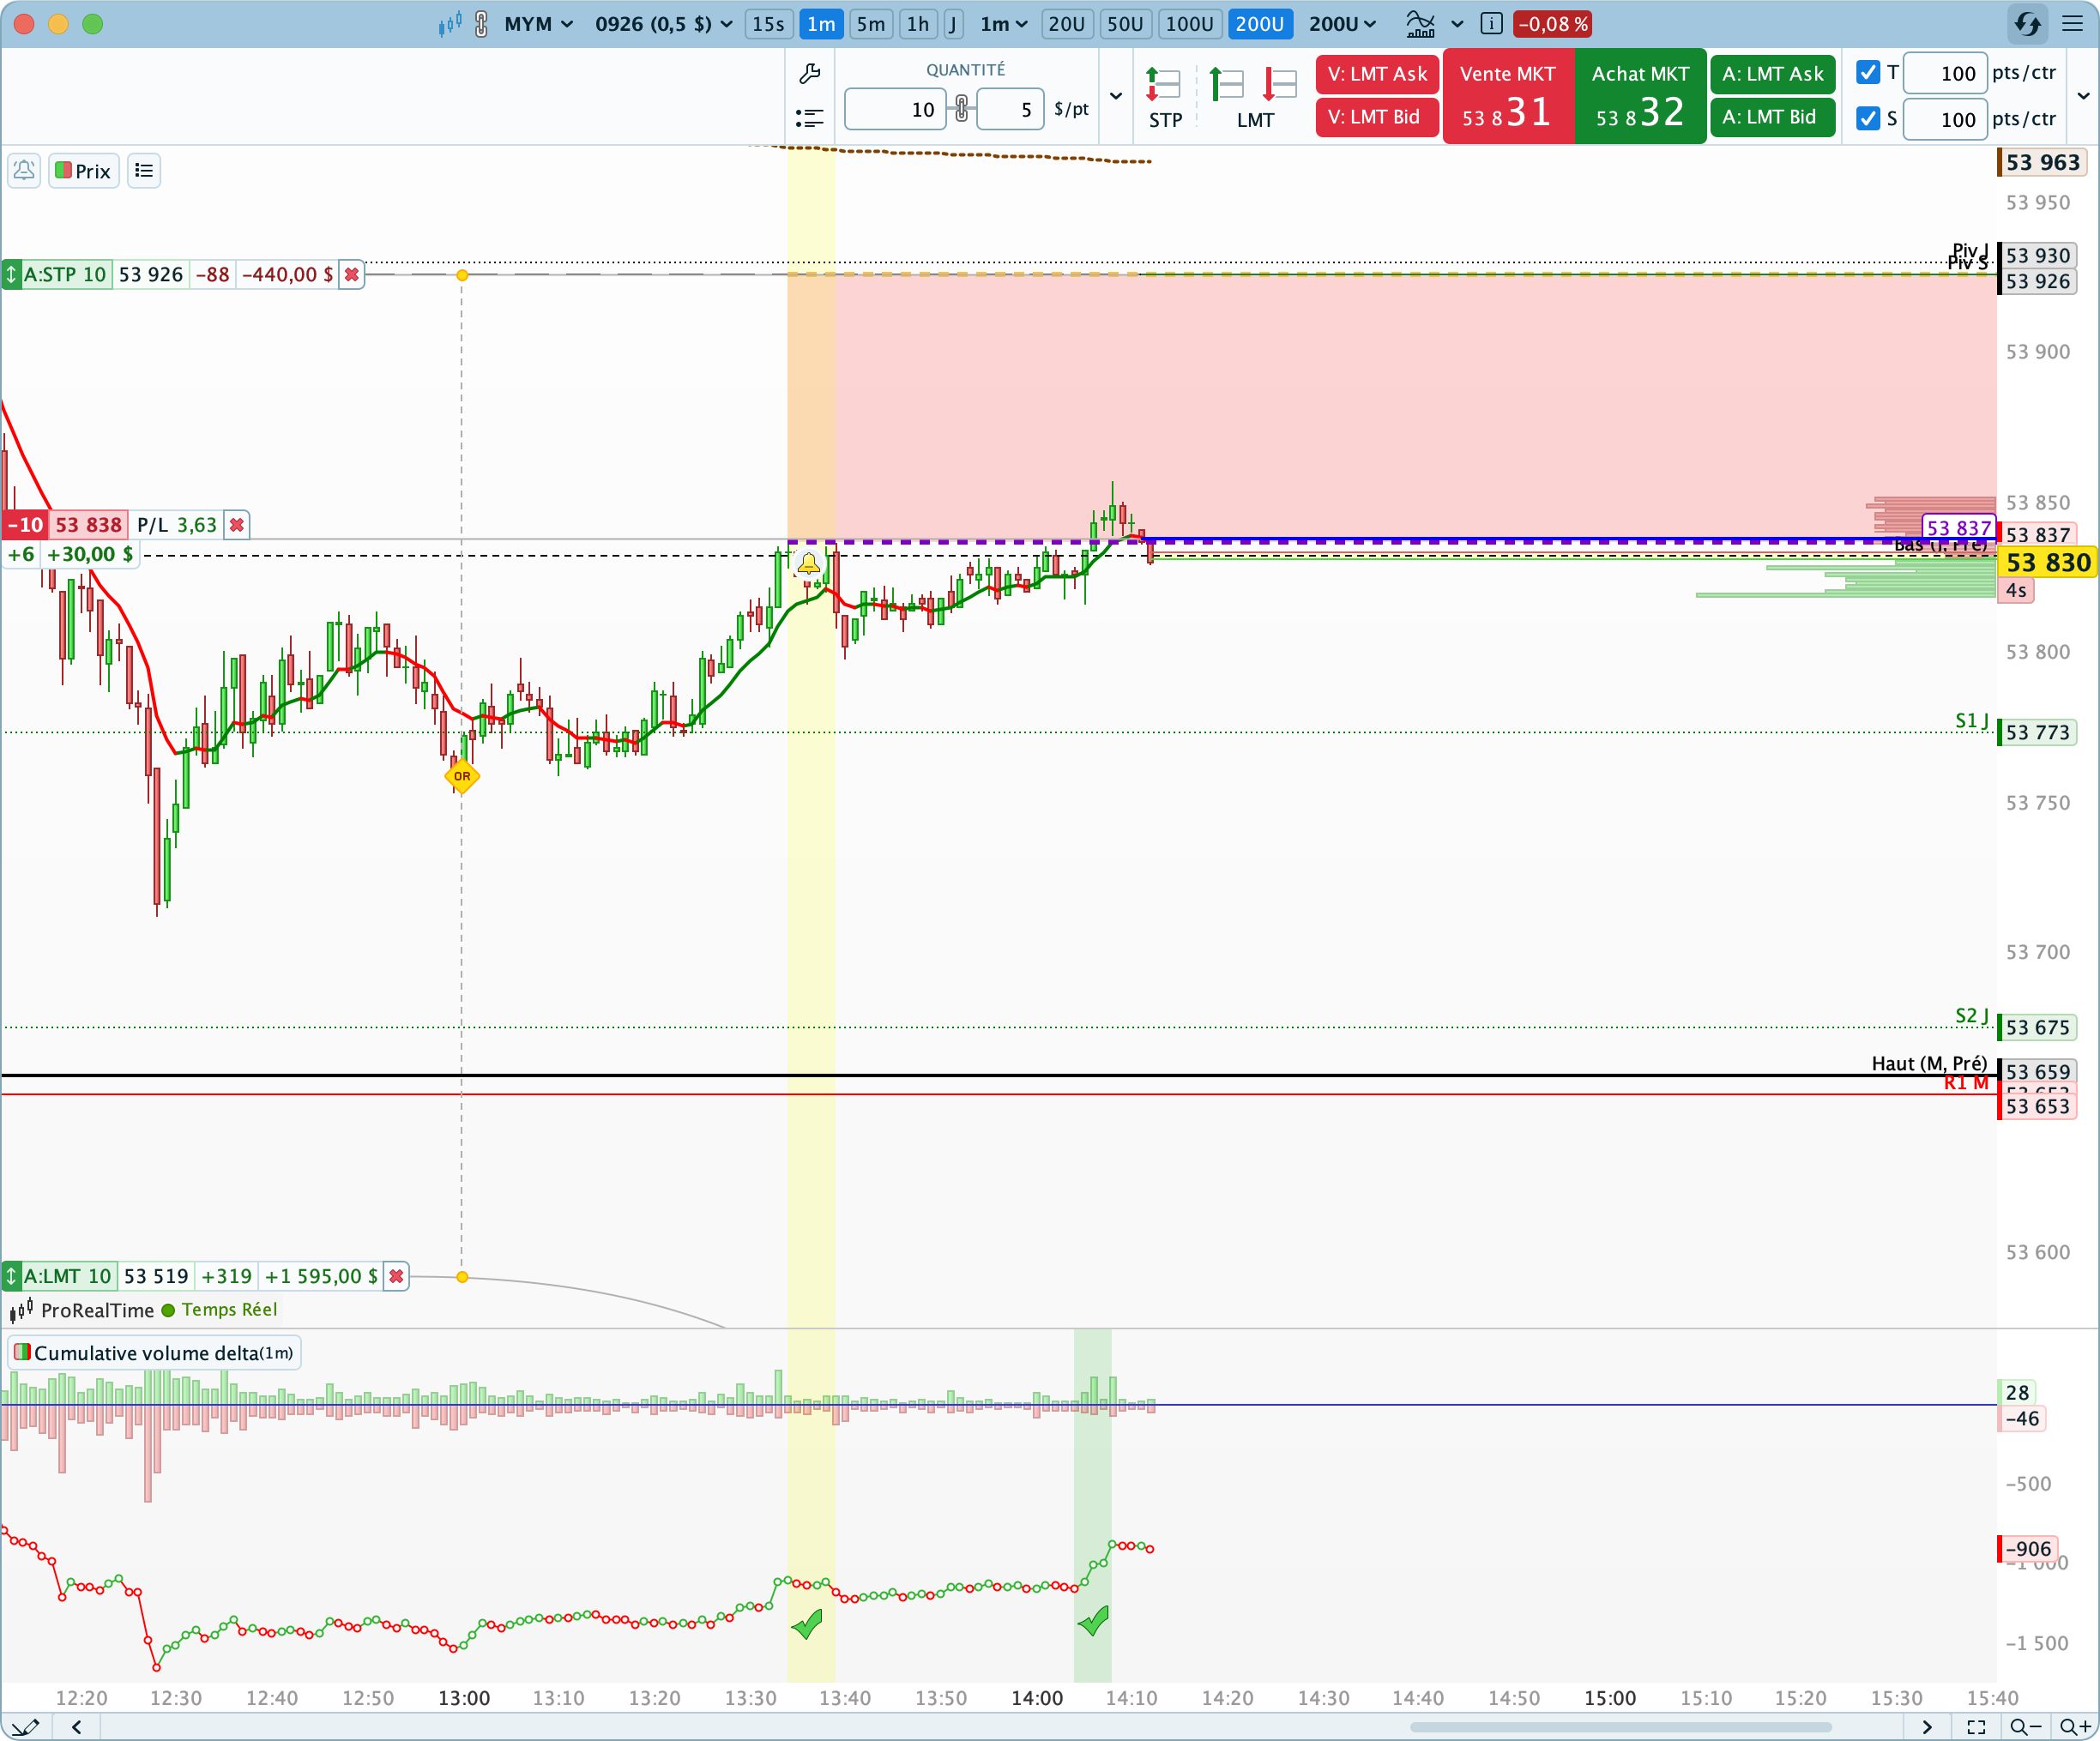
The break above the previous session's high triggered a buying offensive, but the buyers failed to reach the daily resistance 1. The market could therefore go hunting their stop-loss orders below the 52812 point support.
The break above the pre-open high triggered a buying offensive, but the buyers failed to reach the weekly Support 2. The market could therefore turn lower, with the monthly pivot point in its sights.
The break above the pre-market high triggered a buying offensive, but the buyers failed to reach the daily support.1. The market could therefore resume its downtrend towards the monthly pivot point.
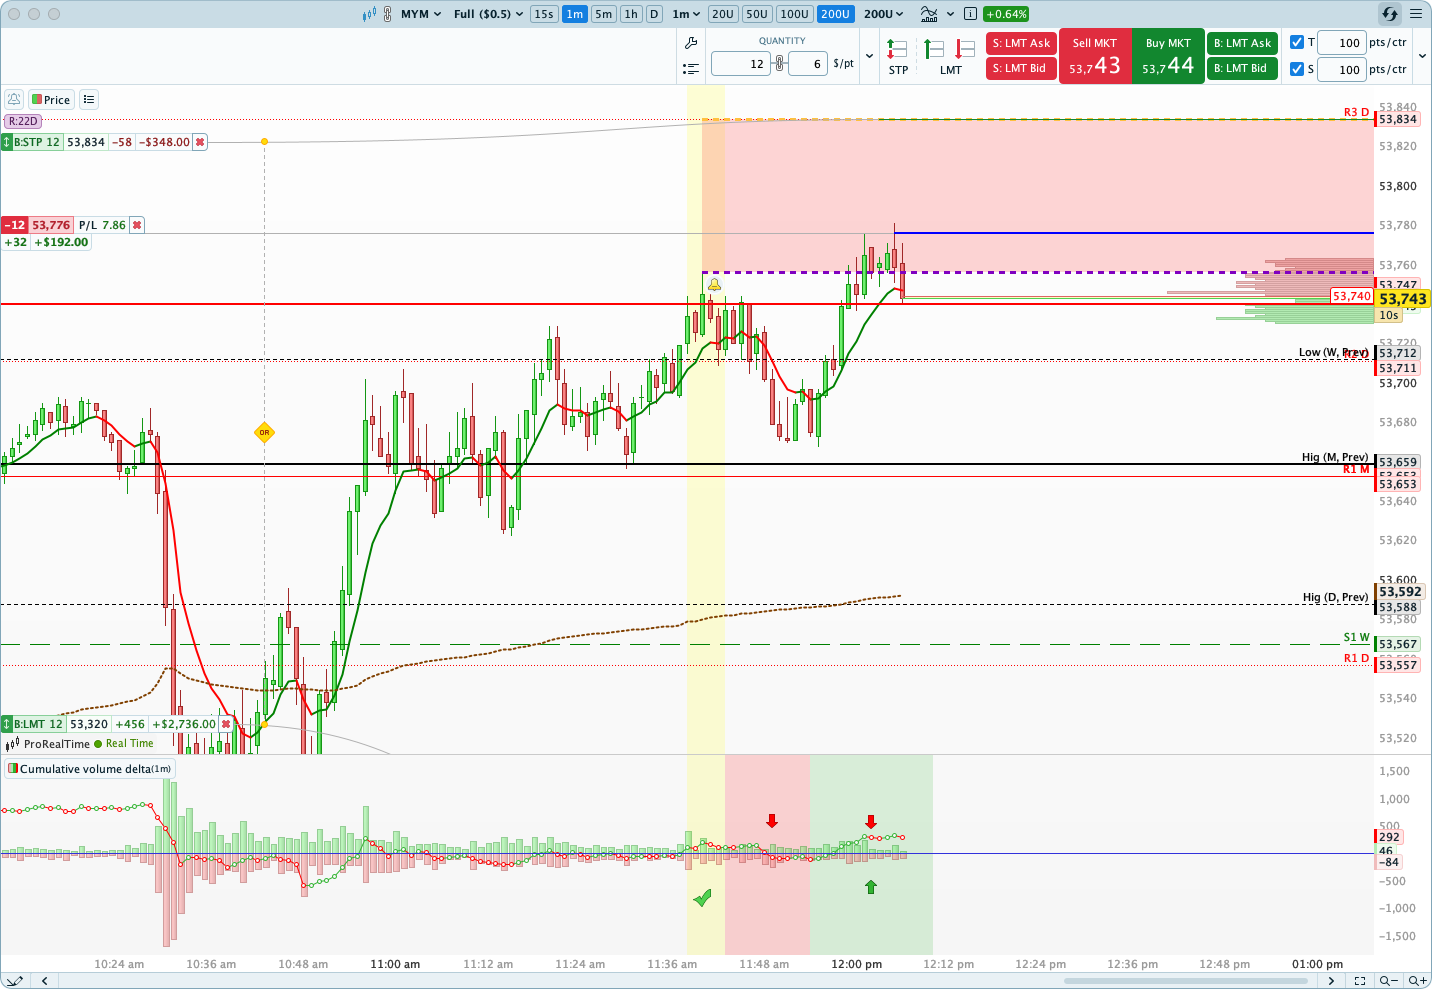
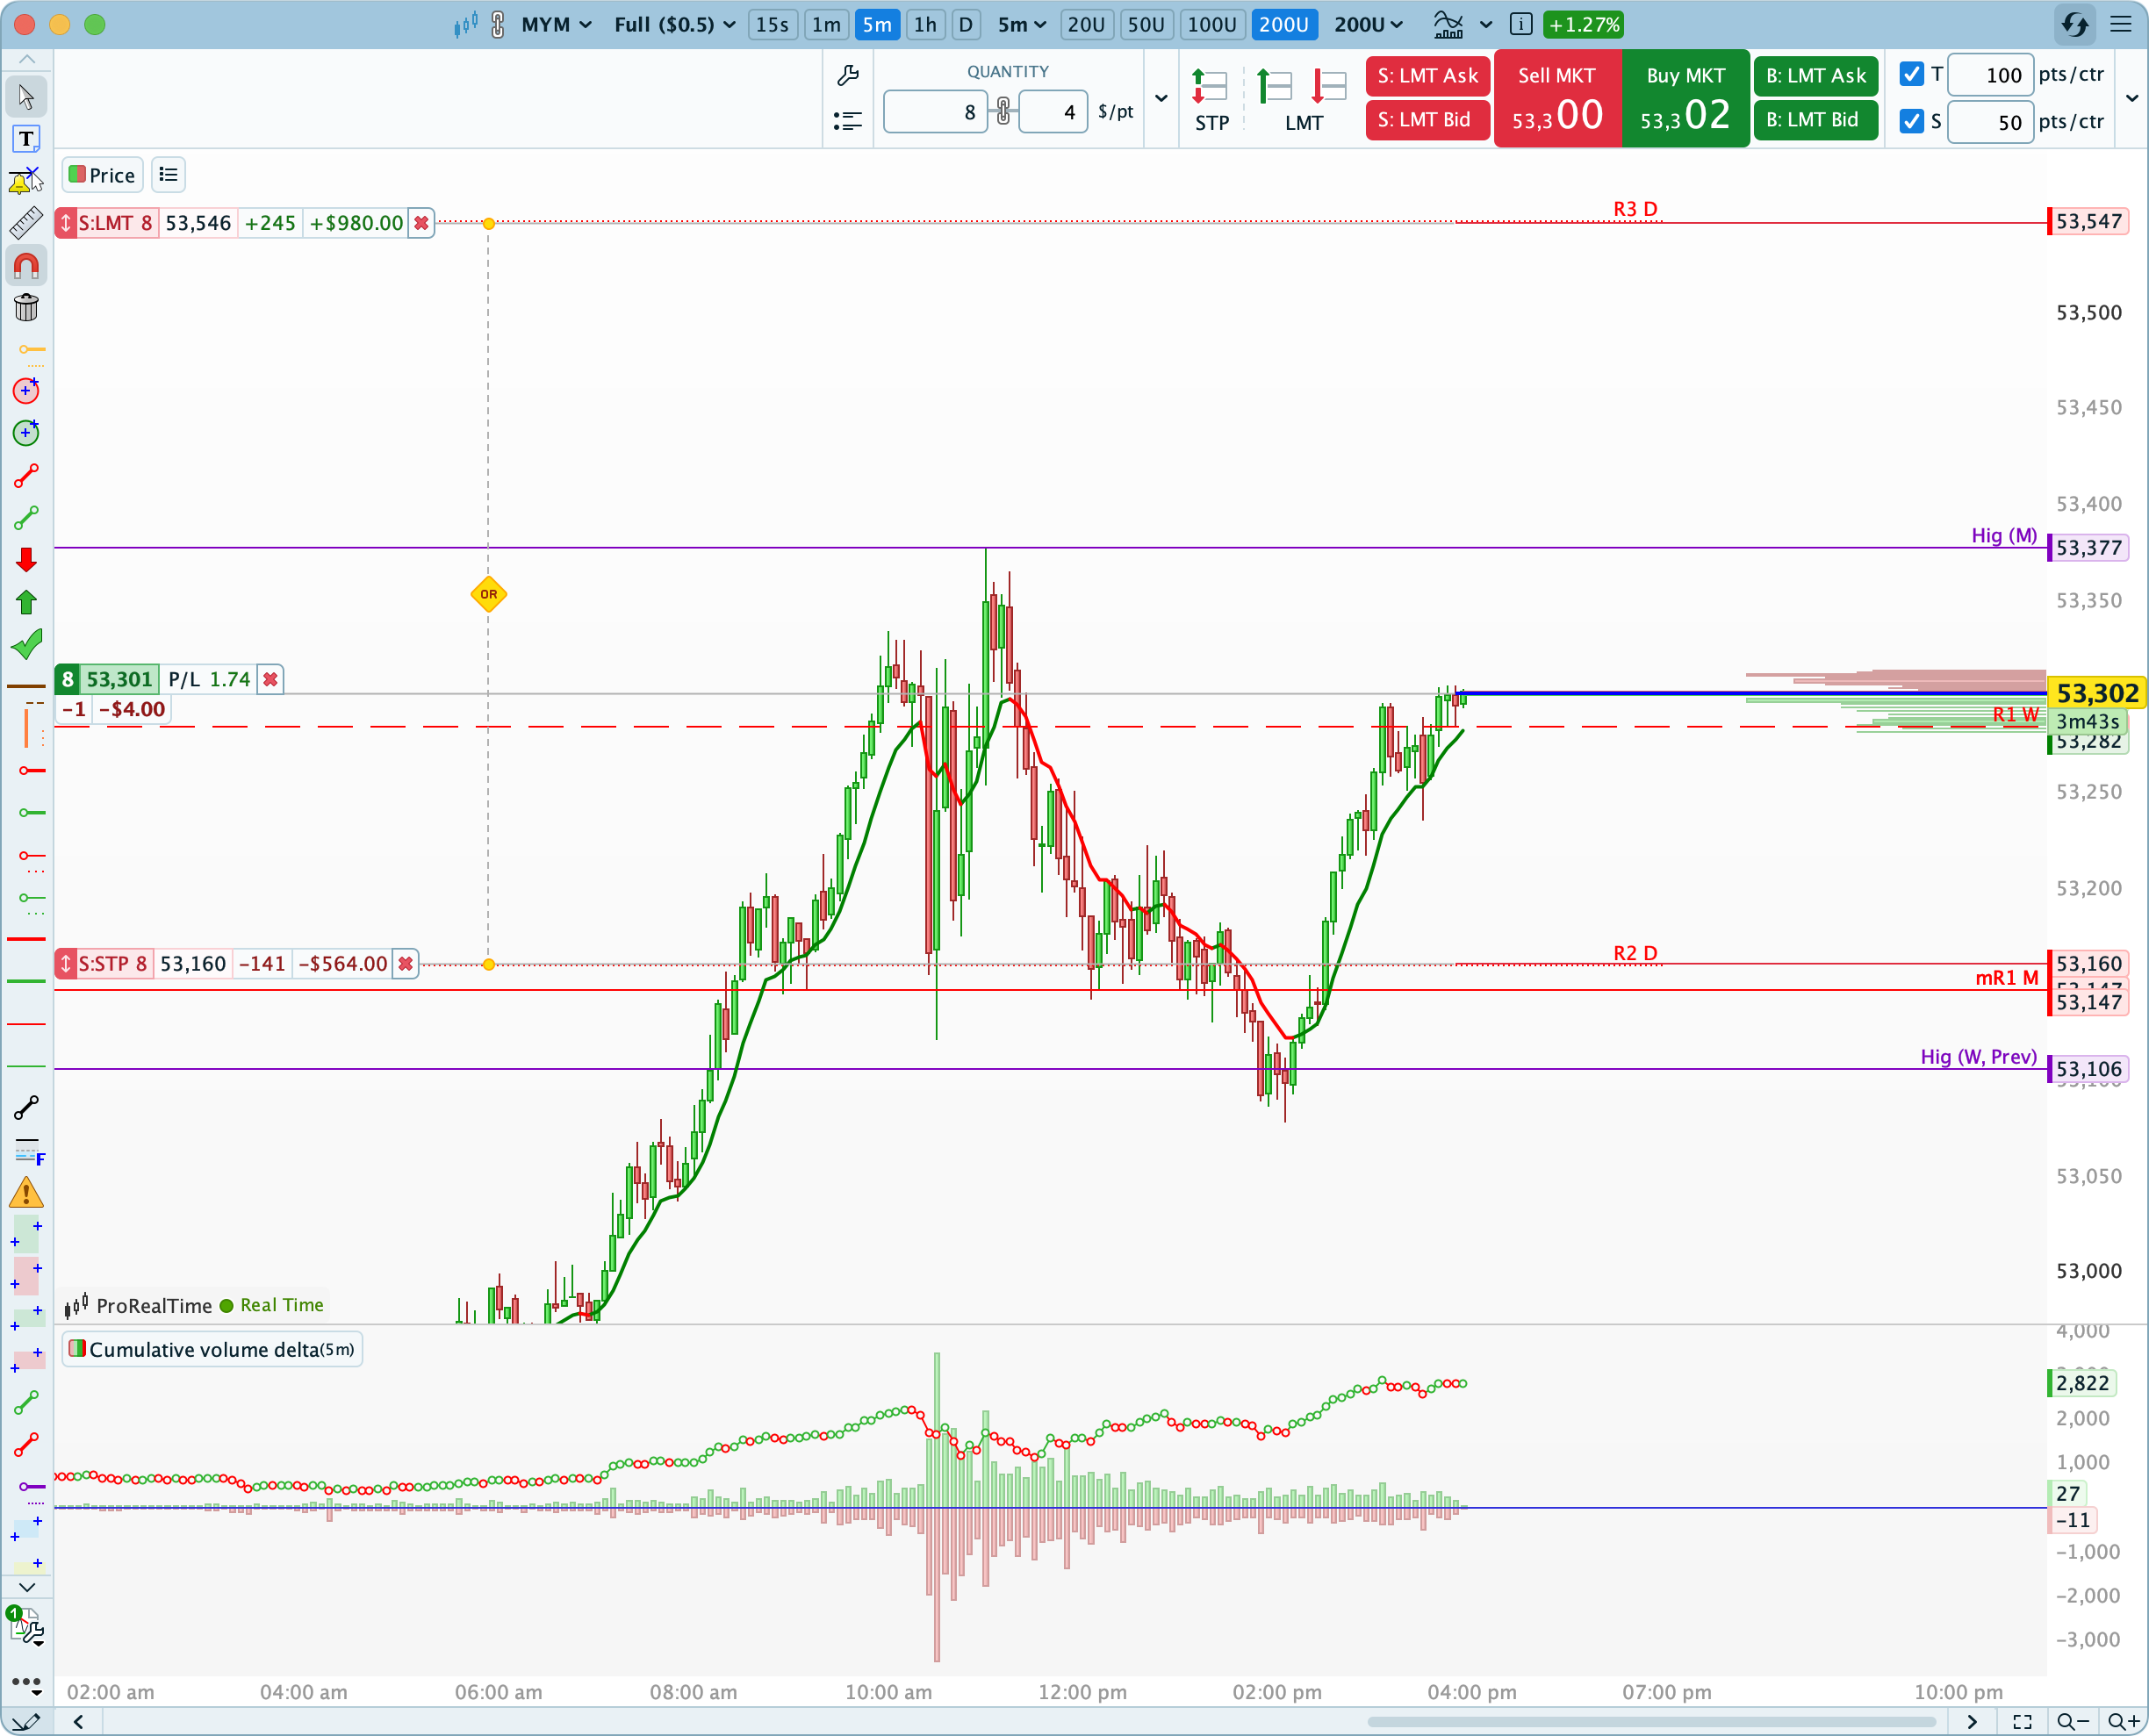
The break above the symbolic 53,750-point level (matching the pre-open high) triggered a buying push, but the buyers failed to reach the daily Resistance 3. The market could therefore go hunting their stop-loss orders below the 53,311-point low.
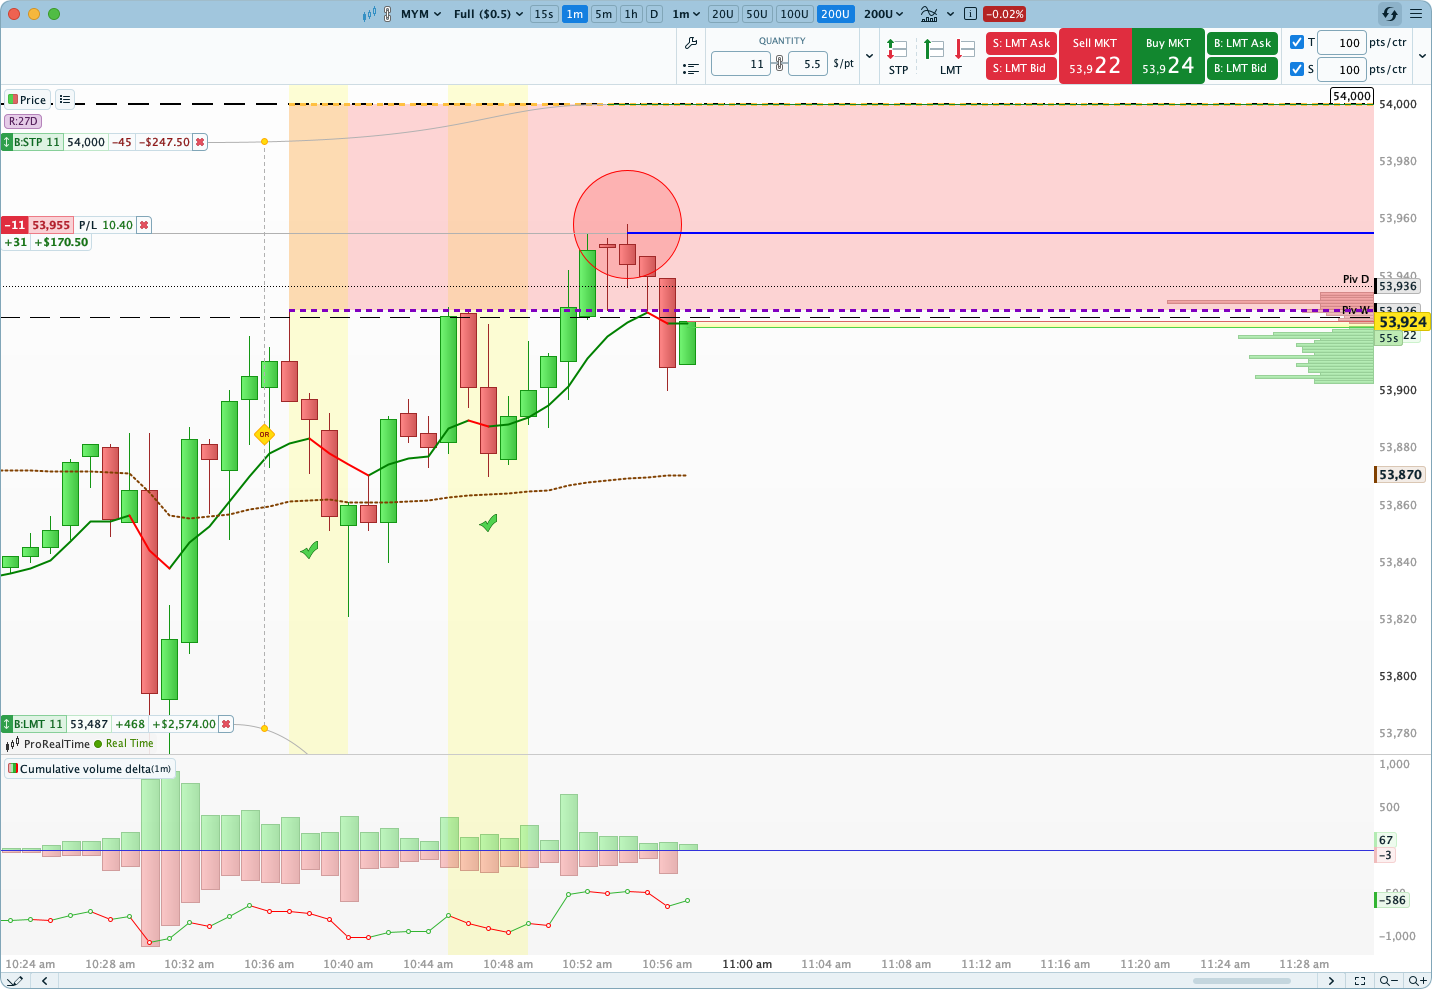
The break of the weekly pivot point triggered a buying offensive, but the buyers failed to reach the symbolic 54000-point mark. The market could therefore turn lower and attack the monthly pivot point, aiming to go after the next key level (daily support 3).
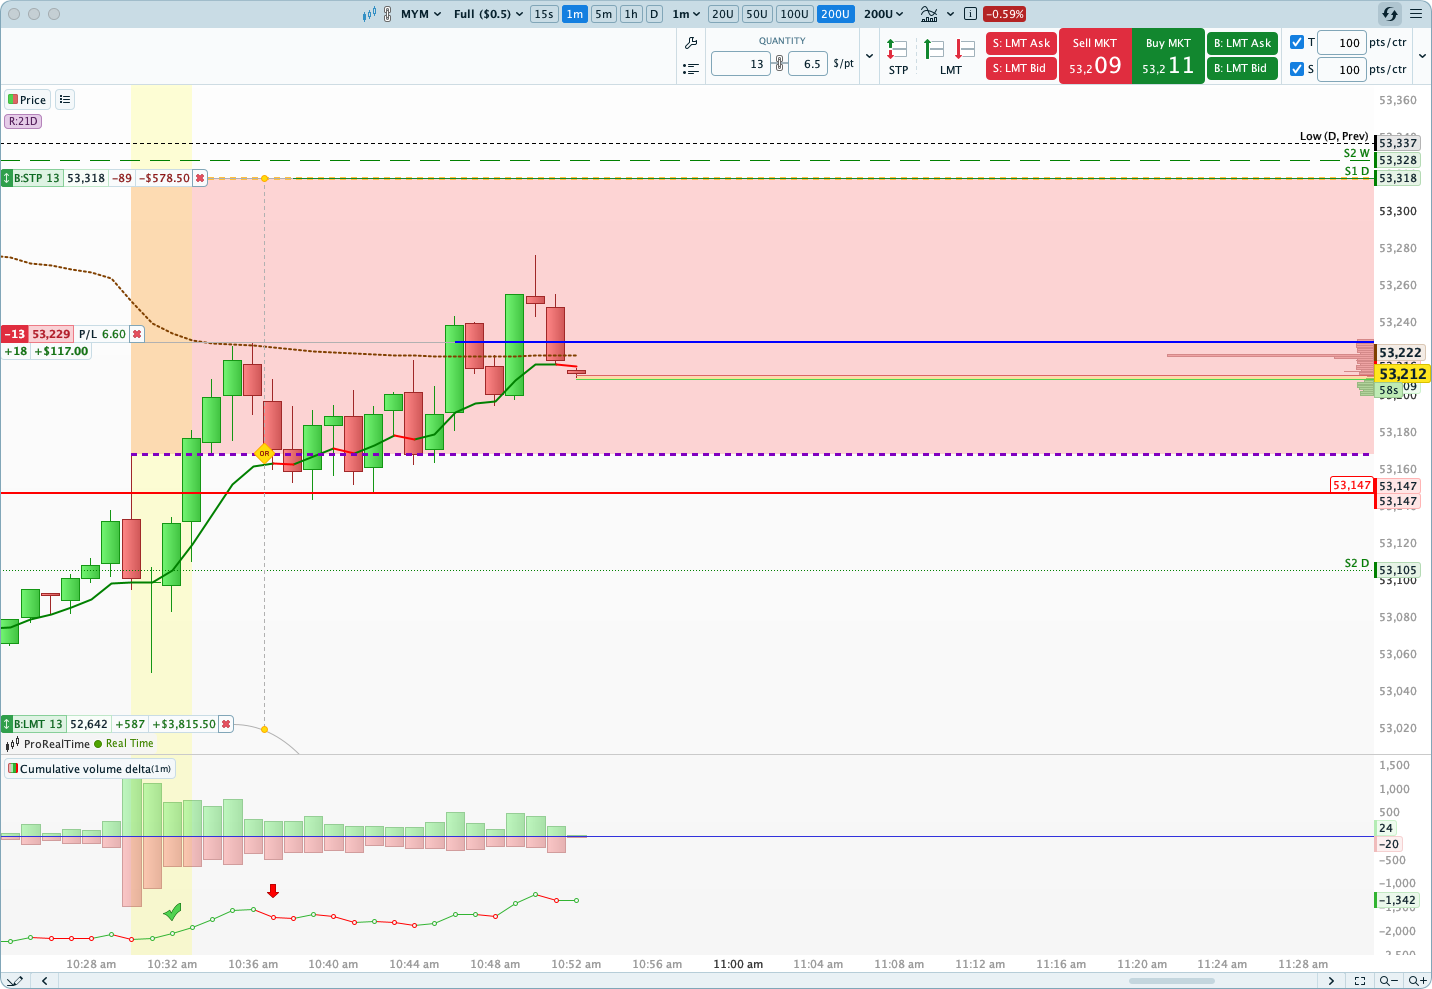
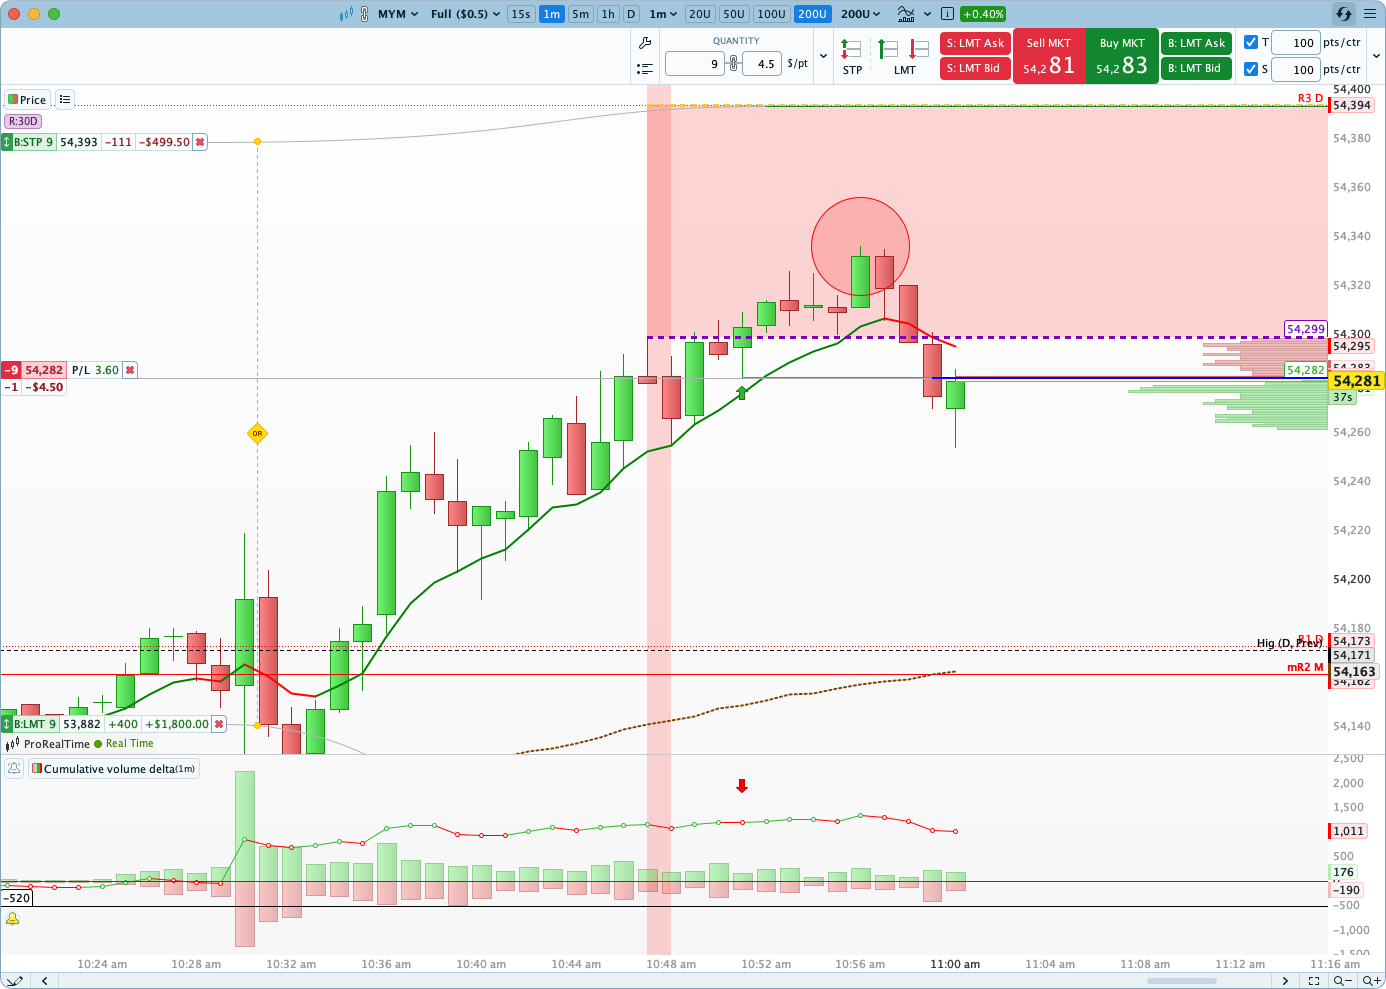
The reclaim of the previous day's low triggered a buying offensive, but the buyers failed to reach the weekly pivot point. The market could therefore go after the monthly pivot point, aiming to grab the next key level (daily support 3).
Educational signals. This is not investment advice nor a recommendation to buy or sell the Dow Jones future.
Where do these signals come from?
These signals are based on the NewTrading method. They put into action the weekly plans shared in our newsletter, using the system taught in our course.
Maxime publishes each signal on the Dow Jones Future he has been trading for 15 years.
How to read a signal?
EntryThe desired buy or sell price: green arrow = buy, red arrow = sell.
StopThe level that invalidates the trade. We cut, no debate.
TPTake Profit: the target where the gain is locked in.
R/RRisk/Reward ratio: what we aim for versus what we risk.