5 Popular Day Trading Strategies & How They Work


Most traders know the basics of identifying profit opportunities on a chart before the breakout or breakdown occurs. The challenge is applying a strategy aligning with how the market actually moves.
This guide breaks down five widely used strategies—how they work, when they tend to be effective, and risks to watch out for.
Whether you look to ride momentum waves, trade breakouts, follow the trend, pounce on news-induced volatility, or focus on range trading at the open, step one is recognizing setups and then executing your own approach to reap potential profits and manage risk.
Let’s get started.
#1 – Momentum Trading
Momentum trading is among the most popular strategies to take advantage of what’s moving in markets, either bullish or bearish. It involves capitalizing on existing trends and establishing a position once a breakout or breakdown transpires.
The phrase “buy high, sell higher” is apropos here. The objective is to buy securities that are rising in price (and exhibit indicators suggesting they will continue rising) and sell assets that are falling in price (and exhibit indicators suggesting they’ll keep dropping).
Momentum trading is built on the premise that new fundamental information is slowly discounted into assets—as more investors accept that news, they buy in, pushing the price up. For technical traders, of course, we don’t care why a stock is moving, only that the risk and reward construct is favorable for that trend to persist.
Hence, investor psychology and market dynamics play major roles in momentum trading. Traders commonly use momentum oscillators to help them spot high-momentum opportunities, and applying relative strength analysis is another helpful tactic.
An Example
Momentum traders constantly monitor price movements, which can be over any timeframe. They may look for so-called “swing trading” plays over the course of a few weeks or months, always seeking to identify assets with strong absolute and relative momentum. In the ProRealTime chart example below, we’ve highlighted a daily chart of Netflix (NFLX). It had a classic breakout followed by a momentum thrust.
Netflix (NFLX) Daily Chart: Pullback and High-Momentum Rally
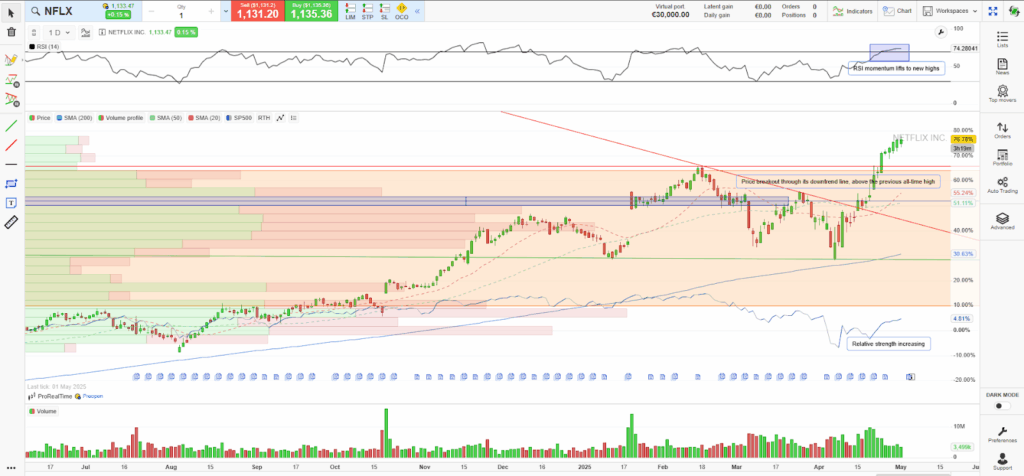
Notice in the chart that shares rallied through a downtrend resistance line in April. During its pullback that began in February, the Communications Services sector stock featured a series of lower highs and lower lows but found support just above the $800 mark and its rising long-term moving average. That was the setup for the eventual high-momentum upside move that transpired ahead of and after its late-April earnings report.
In this instance, the first key zone was near the March rebound high of $999. Once shares rallied through that point in April, it was a go for launch. The stock began a multi-session winning streak, eventually breaking out above its previous all-time high of $1064.50. The RSI momentum indicator at the top of the chart broke its downtrend line, confirming the price advance. Shares went on to rally multiple percentage points above the February zenith, with significant relative strength to the S&P 500.
Long with a stop below the previous all-time high is a possible exit strategy. Traders could have also played a measured move upside price target exit, which would be the previous $243 trading range, added to the previous high, which would be $1308.
Risks and Common Pitfalls
The key to momentum trading is getting in early enough to ride the existing trend’s wave while fuel’s still left in the tank. A risk is entering a position too late, and getting whipsawed out of the play. Another challenge with this trading style is that false moves can quickly reverse—momentum unwinds can be perilous. So, risk management is essential.
Keeping a trailing stop can be good practice, or placing a stop under support (if long) or above resistance (if short) is prudent. Also, be sure to position size accordingly—highly volatile securities generally call for smaller positions.
#2 – Breakout Trading
Breakout trading is similar to momentum trading, but there are significant differences.
This strategy zooms in on price breakouts (bullish) or breakdowns (bearish). Like with most momentum trading schemes, the idea is to be exposed at the onset of a trend. You must have discipline, however, as aiming to buy a stock before a breakout is fraught with risk. Rather, you should look at indicators to tell when a breakout has already occurred before putting capital at risk.
The ideal breakout candidate is a chart showing some kind of consolidation phase—that could be a rectangle pattern, a triangle, flags, or even just key psychological levels, including round numbers. Volume is also your friend—a consolidation period is often marked by light volume. The subsequent breakout phase should feature higher volume, but that’s not a firm rule.
An Example
For a clean breakout, let’s light up the chart of Philip Morris International (PM). This Consumer Staples stock is among the most defensive ones in the market, and it featured a classic upside breakout that traders could have seen coming.
Philip Morris International (PM) Daily Chart: Consolidation and Subsequent Breakout
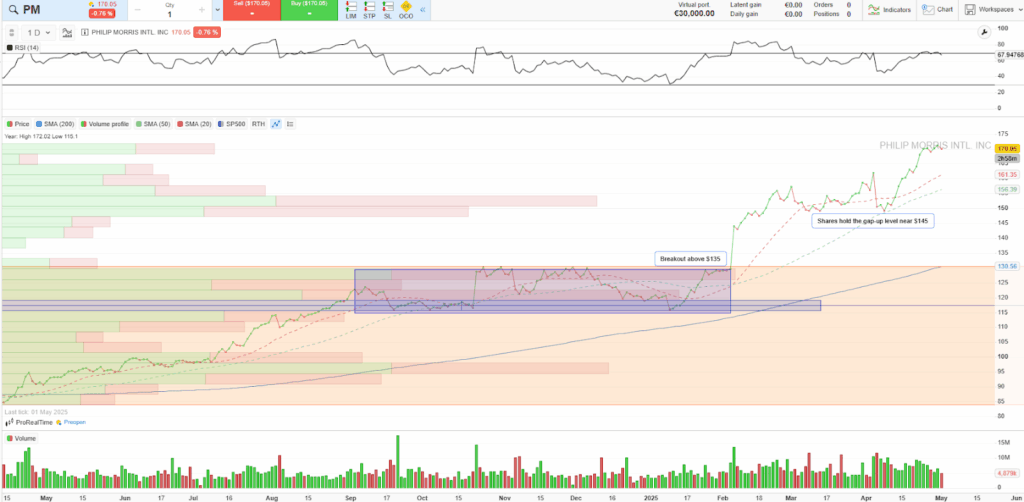
Notice above that the key feature on the ProRealTime chart was a months-long consolidation range. This rectangle sported resistance at $134 and support near $116—a zone of $18. Following an earnings release in February 2025, shares massively gapped higher.
The novice trader might have bypassed the stock, thinking that the immediate 10%+ jump was too much, too fast. But breakout traders knew better. That so-called “breakaway gap” was bullish, portending a continuation of the trend of larger degree—higher, in this case.
We could split hairs and call it a “runaway gap,” too. PM quickly achieved its upside measured move price objective to $152 (based on the height of the previous range), but the breakout was so decisive that gains persisted, with PM notching highs above $170 by May.
The breakout occurred on higher volume, as well. It’s important to remember that dollar volume means more than share volume—since PM had a higher stock price after the breakout, the average daily amount of shares traded meant more money was exchanging hands. Also helping to confirm the upside breakout was high relative strength to the S&P 500, while the RSI momentum oscillator at the top of the chart ranged in a bullish zone between 40 and 90.
Risks and Common Pitfalls
Breakout trading is prone to risks from false moves. Traders say, “From false moves come fast moves in the opposite direction,” so it’s important to have a stop-loss order with breakout plays.
For PM, a stop-out below the previous high of $134 would have been prudent, but the risk there is that the earnings gap down to $130 could have been filled while keeping a broader uptrend in place. Volatility is both a friend and enemy to breakout traders—big moves can quickly unravel, increasing the chance of a shakeout.
#3 – Trend Trading (Intraday Trend Trading)
Technical trading can suit a range of investor preferences. Each market participant has their own timeframe, and among the most granular day trading strategies is intraday trend trading.
It seeks to identify and follow the primary trend within a single session. Whereas swing trading is longer-term, and scalping or fading seek to spot short-term reversals, trend daytraders eye clean directional moves and remain in the play so long as the technical indicators suggest.
The first step is straightforward but not always easy: identifying the trend. Since we are discussing intra-session price action, you have limited time to determine whether the action is bullish or bearish enough to take a position.
Moving averages, volume-weighted average price (VWAP), or a basic structure of a series of higher highs and higher lows are features used to lay the foundation for a trending day trading idea. Once the trend is established, entering on a pullback or consolidation is the traditional approach.
An Example
An interesting example is a recent Tesla (TSLA) ProRealTime chart. A pattern emerged of mass selling shortly after the market’s open. Resistance emerged between $290 and $295, so there was a defined upside level to gauge.
Here, an intraday trend trader could have shorted TSLA at the open on April 30, then bought back shares near support in the low $270s. Then, a reversal strategy—going long TSLA based on a near-term uptrend would have offered potential profits.
TSLA Intraday Trending Trading: Riding the Upside
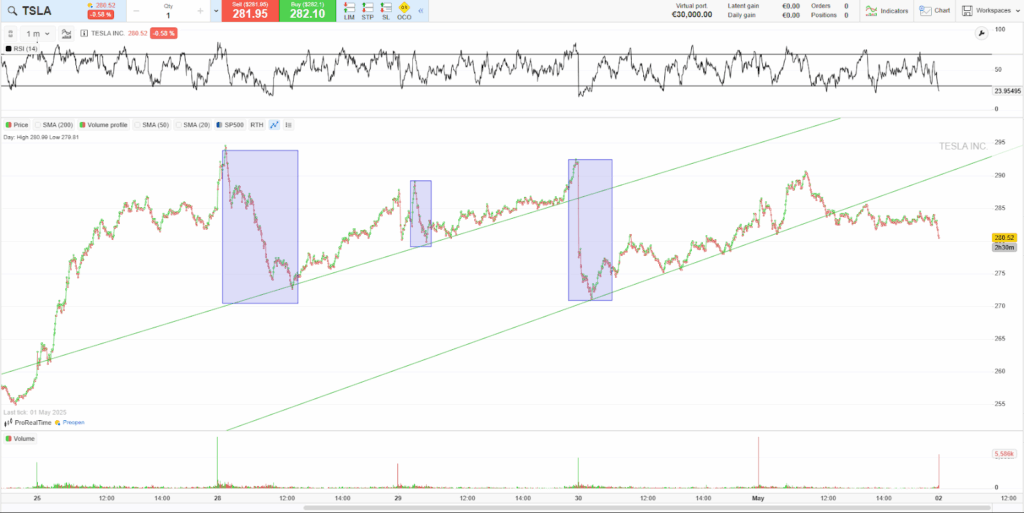
As with most trading techniques, the exit is just as crucial as getting the entry right—it’s often even more critical. Using our real-life example with TSLA, the strategy worked well through the morning and early afternoon. Shares lifted, holding trend-line support during the session, which brought the trader a decision: Book profits now, or hold to see what the next trading day has in store?
Discipline is imperative—exiting the long position and flattening out before the closing bell is a hallmark of intraday trading, so you shouldn’t stray from that if this is your style. TSLA can be a volatile name, so large gaps up or down could happen with little warnings, causing potentially catastrophic losses to leveraged traders. That’s a risk that is not worth accepting for many day traders.
Risks and Common Pitfalls
Along with emotional and practical discipline, there are other risks to consider with intraday trend trading. For instance, you should have stops in place below technically important price points.
In the TSLA example, under the uptrend support line established on April 30 is the obvious line in the sand. If, say, you bought after a bullish marubozu 5-minute candle, then a stop under that formation would have been ideal. If a moving average were your chart bogey, that would have also been your exit trigger (if shares fell below it). A common risk is trying to pick tops and bottoms, but that’s not the mission here—it’s the meat of the move before that closing bell rings.
#4 – News Trading
News trading combines technical analysis with fundamental releases that stir up volatility. It involves executing fast trades on fresh information—macro data, micro earnings, geopolitical headlines, or breaking news—all of it falls under the news trading umbrella.
Volatility and volume—that’s what you should hunt for. When everyone else panic buys or sells, your goal is to play price action unemotionally by setting pre-defined entries and exits.
Now, there are two primary methods by which you can trade news. First, you anticipate it. The most up-front situation is with earnings releases. Once per quarter, companies issue profit results, and you can use history as a guide as to the share-price direction. As traders, we don’t care what the revenue, margins, and earnings are. Instead, it’s the price response that matters.
Moreover, we can lean on the options market. Assuming you’re trading liquid stocks, the earnings straddle (the cost of the at-the-money put and call) gives insight into the expected move, up or down, post-earnings. That’s just one example of preemptively trading company news. The same logic applies to the aforementioned information types.
Second, you can simply trade the reaction. If a stock rallies after an earnings event, then going long, using risk management techniques is a wise approach. Conversely, if the S&P 500 drops after a bad economic release or a stock falls in response to poor earnings, then waiting to find support, then buying, is a contrarian tactic.
Speed is critical. You might need financial news in the background at your desk or access to real-time headlines on a screen to stay with the game. Remember: You compete with algorithms and high-frequency traders, so the deck is stacked. Your edge? Interpreting price action.
An Example
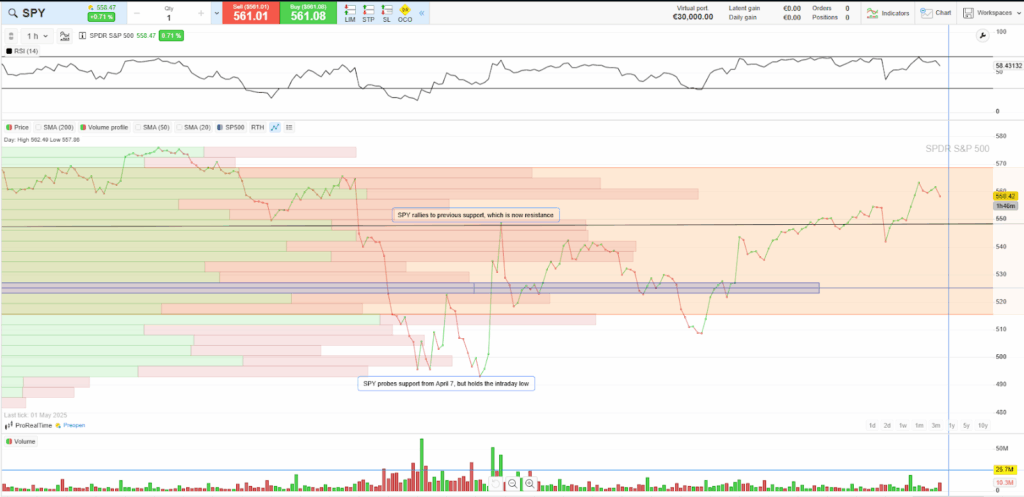
Let’s look at perhaps the most pivotal news event and market responses in years: The S&P 500’s April 9, 2025, jump and pullback after President Trump’s announcement that a pause would be put on reciprocal tariffs. Anticipating that news event would have been challenging, but playing the response was actually simple, using basic technical analysis, day trading strategy, and risk management.
The S&P 500 ETF notched a low of $481.80 on an intraday basis on April 7, held that mark on the following day, then was barely above it on the morning of Wednesday, April 9. A week after Liberation Day, the president posted on social media that a 90-day reprieve from extremely high import levies would be granted. The stock market ripped 10%. A fast news trader could have gotten on board immediately when the news crossed the wires.
As annotated on the ProRealTime chart below, the exit would have been to sell once SPY approached its March low of $549.68–the polarity principle of technical analysis asserts that once support has been breached, it becomes new resistance. That’s what transpired with SPY. So, quick gains could have been banked (in a risk-centered way) based on that major macro news item. A natural stop-loss point would have been below the morning’s low of $493.05.
S&P 500 ETF (SPY): Trading the News of a Tariff Delay
Risks and Common Pitfalls
Risk is elevated with news trading because volume is not always ideal. It’s common to see bid/ask spreads widen when wild price action occurs, resulting in price gaps on even the most widely traded stocks and ETFs. Whipsaws are common, and sometimes, it’s just not feasible to perform in-depth risk management analysis due to the time crunch. Still, stops and limits are important, as well as only putting as much capital at stake as you are willing to lose, depending on your risk level.
#5 – Opening Range Trading
Opening range trading focuses on the initial hour of trading. This period often sets the tone for the session, and key support and resistance levels commonly show themselves. First, you want to identify a security’s high and low, then apply your preferred daytrading technique (range trading, breakout trading, momentum trading, etc.)
An Example
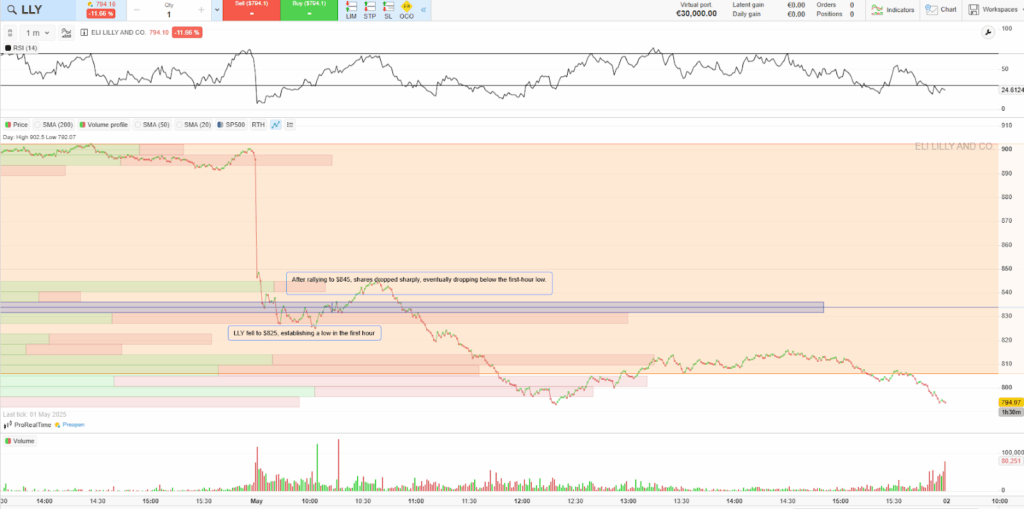
Eli Lilly (LLY) is a classic example of how crucial the opening range is—the first hour of trading after the pharma giant reported Q1 earnings on May 1, 2025, sucked the bulls in. A low of $825 was established, then the stock quickly rallied $20, about 3%. It would have been reasonable to take that as a cue to get long, but that would have proved perilous.
LLY went on to fall below the first-hour nadir, and traders with a risk management strategy would have been safely stopped out with a modest loss. We use this as an instance where the plan does not always work. A disciplined exit—particularly in case of a loss—is critical to living to trade another day.
LLY would go on to have its worst session since 2008, never climbing back to its opening-hour low of $825 that day. On the other hand, playing it from the short side may have been a profitable tack—shorting LLY with a buy-stop above $825 once the early-session key levels were established could have led to major profits.
LLY: A First-Hour Fakeout, Lower Prices After the Early Recovery
Risks and Common Pitfalls
Volume and volatility are highest around the market’s open, making it a fertile time for traders—but that also brings risk. Slippage, price gaps, and fakeouts may happen quickly. That was the case with LLY, as the recovery from the initial low appeared strong. Trading the open demands acting fast and being nimble by establishing your exit prices, then sticking to them as the day unfolds.
Final thoughts
Day trading is risky. Even experienced traders take losses, and without a clear edge and risk control, those losses add up fast. The strategies in this guide—momentum, breakout, trend, news, and opening range—are commonly used, but none are foolproof.
What separates successful traders isn’t the number of strategies they know. It’s their ability to stick with one approach, understand how it behaves in real conditions, and manage risk with discipline.
If you’re just getting started, don’t rush in. Use a trading simulator to practice. You’ll get a feel for setups, execution, and volatility—without risking your capital.
Test your approach in a simulator before you trade live. It’s the smartest way to build real skill.

Mike is a CFA® charterholder and Chartered Market Technician® with a background in trading, risk management, and financial education. He brings years of experience writing about markets, investing, and retirement planning for a broad audience.


7 Popular Swing Trading Strategies with Practical Examples

The Most Popular Chart Patterns in 2026
