Fundamental vs. Technical Analysis: Which One Should You Use?


If you’re an active trader, you’ve definitely heard the debate. One side says, “Forget the news — the chart tells you everything.” The other side scoffs, “Good luck with your squiggly lines — I’ll stick to real business metrics.”
So…who’s right?
Honestly? Both — but only if you know when to use what. Technicals help you time your moves. Fundamentals help you dodge disasters. The real mistake isn’t picking the wrong side. It’s using the right tool at the wrong moment.
Let’s break it down: when technicals matter, when fundamentals do, and how to avoid mixing signals that don’t belong together.
When is Technical Analysis More Useful than Fundamentals?
Price discounts all news. It’s one of the six pillars of Dow Theory—and one of the biggest reasons technical analysis even exists.
The idea is that everything knowable about a company, the stock market, and the economy is discounted into that one little price you see scrolling along the bottom of the TV screen.
In the short term, price doesn’t care about intrinsic value. It moves because buyers (or bulls) want in and sellers (or bears) want out. It’s a tug-of-war. And the side with more muscle—more conviction—wins.
So, here’s a simple way to think about it: fundamental analysis tells you what to buy, while technical analysis tells you when to buy.
That “when” matters a lot if your time horizon is short. Long-term investors can afford to wait. They dig into balance sheets, calculate fair value, and assume the market will eventually agree with them. Technical traders, on the other hand, are watching for breakouts, breakdowns, and moments when the crowd starts to lean too far in one direction.
You might wonder why time horizon is regarded as the difference. It’s not a hard and fast rule, but there’s little debate that investors’ collective emotions (Wall Street’s animal spirits) and positioning drive immediate trends.
It’s not that valuation metrics are useless. They’re just slow. Moving averages, volume spikes, and price action give faster signals—the kind you need if you’re day trading or riding short-term momentum.
That’s why time frame matters. It’s not a rule, but a pattern. In the short run, markets move on positioning and emotion. In the long run? Maybe they make sense.
But day to day? The chart usually knows before the spreadsheet does.
A Practical Example
It helps to use an example to differentiate technical analysis from fundamental analysis. Suppose a high-momentum glamour stock has an earnings event on tap. Shares rally into the quarterly report, notching an all-time high before the post-market data release.
A technician might buy the stock—despite its high valuation—banking on the prospect of further gains. The trader puts in a 10% stop-loss order below the previous week’s low for risk-management purposes. The company beats on earnings (but the technician doesn’t care about that!), and the stock jumps.
Instead of taking immediate profits, the trader continues to hold the stock but raises their stop-loss order.
Tools That Help Traders with Technical Analysis
Part of what makes technical analysis potentially more useful than fundamental analysis is the bevy of indicators at a trader’s disposal.
There are literally hundreds of gauges and signals (likely thousands, these days). We mentioned just a few earlier, but there are so many more that suit a range of trader time horizons, trading methodologies, and risk preferences.
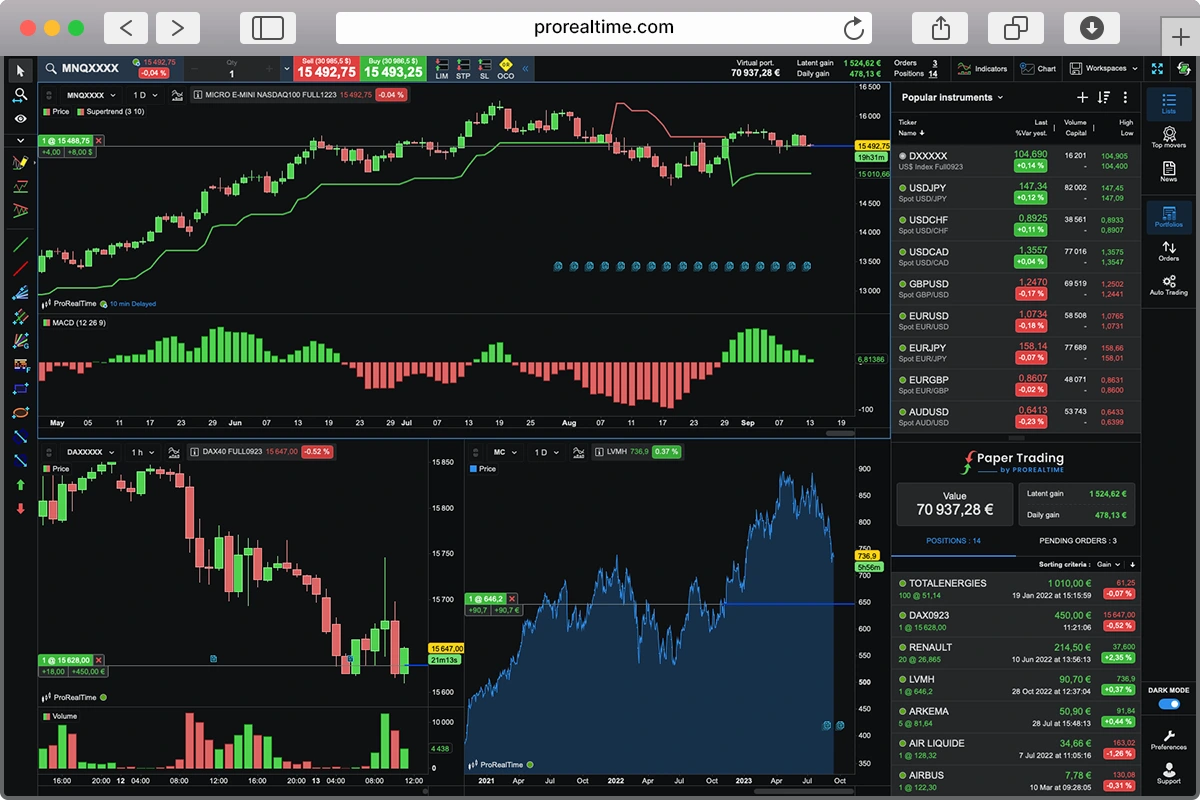
Trading platforms such as ProRealTime have all you need and more to navigate today’s complex and volatile markets. Technical Indicators can be applied across asset classes, too. Here are some of the most popular:
| Indicator | What It Is |
|---|---|
| Moving Averages (Simple, Exponential, Geometric) | Smooth out price data to identify trends by averaging past prices. |
| MACD (Moving Average Convergence Divergence) | Shows trend changes by comparing two moving averages and their difference. |
| RSI (Relative Strength Index) | Measures momentum by comparing recent gains and losses on a 0–100 scale. |
| Donchian Channels | Plots the highest high and lowest low over a set period to show breakouts. |
| Stochastics | Compares a closing price to its price range over a given period to gauge momentum. |
| Rate of Change (ROC) | Measures the percentage change in price over a specified time frame. |
| Average True Range (ATR) | Gauges market volatility by averaging the true range over a set period. |
| On-Balance Volume (OBV) | Tracks volume flow to detect shifts in buying or selling pressure. |
| Bollinger Bands | Envelopes set above and below a moving average to signal overbought/oversold levels. |
NVIDIA (NVDA) Daily Chart with 200-Day Moving Average, RSI, Stochastics

When does Fundamental Analysis matter for Traders?
Technical traders care about what price is doing. Fundamental analysts want to know why it’s doing it.
For swing traders, the line between the two approaches often blurs. If you’re holding a position for several days or weeks, you’re likely using technicals to time your entries and exits. But that doesn’t mean fundamentals don’t matter. Many swing traders also dig into earnings trends, valuation metrics, competitive advantages, and management quality—not to predict long-term growth, but to avoid ticking time bombs.
The goal? Steer clear of low-quality stocks that might look strong on a chart but are one bad headline away from imploding. A bullish setup can fall apart fast if a weak company gets hit with negative news.
Swing traders may choose to fuse charting with diving into fundamentals like valuation, earnings growth, economic moats, and the quality of a company’s management team. These market participants commonly aim to avoid low-quality stocks, thinking that such securities may be more prone to sudden bad news, which may quickly and violently negate a bullish technical uptrend.
Zoom out a bit, and that context becomes even more critical.
If you’re trading futures—in commodities like crude oil, natural gas, metals, or grains—technical patterns only tell part of the story. Price action in these markets is often driven by supply-and-demand fundamentals: inventory data, weather forecasts, geopolitical risk. A breakout in natural gas during summer means something very different than the same move in winter. Futures traders live and die by these nuances.
Getting more granular, commodity players must have their fingers on the pulse of fundamental supply and demand factors driving moves in the agricultural markets, with industrial and precious metals, and certainly among energy products. The upshot: Some swing traders and position traders need company-specific and macro context in order to manage risk.
You don’t have to focus on a single stock or commodity, though. Fundamental analysis of the economy may help you allocate from what’s known as a top-down approach—going over- or under-weight individual sectors, industries, themes, or geographical regions.
Trading around and having intel about macro data (like monthly jobs reports or inflation surveys) provide investors with breadcrumbs on where the economy, and perhaps the market, may head.
No matter the approach, fundamental analysis can help traders spot valuation gaps. Those are the hidden gems—discrepancies between what the market thinks a security or asset is worth versus what you calculate the value to be based on your in-depth analysis.
A Practical Example
For example, a swing trader in the Health Care sector would certainly keep on guard for volatility around FDA announcements related to, say, shares of a biotech company they owned.
While predicting regulators’ decisions on a new drug or medical device is exceptionally challenging, a trader can limit their position size ahead of the event. Through grit and analyzing the company, they can also position for a positive or negative outcome. In such a case, technical analysis would be less useful, while fundamentals could offer clues that casual investors might miss.
Tools that help Traders with Fundamental analysis
Fundamental indicators are generally more complex than technical analysis tools. It helps to have a finance background—be it an undergraduate finance degree or even advanced certifications like the CFA Charter. However, you don’t have to be a numbers geek or possess Warren Buffett-level acumen; however, with some homework and a dash of curiosity, you can master the most popular metrics:
| Metric | What it shows |
|---|---|
| News and current events | Real-world developments that impact a company’s value or outlook |
| Earnings per share | How much profit a company makes per share |
| Return on equity | How efficiently a company uses investor money |
| Price-to-earnings ratio | How expensive a stock is relative to earnings |
| PEG ratio | Valuation adjusted for expected growth |
| Price-to-book ratio | How the stock price compares to net assets |
| Dividend yield | Income return from dividends |
| Free cash flow | Cash left after expenses and investments |
Eli Lilly (LLY) Favorable Drug News Announcement: Shares Gap Higher, Rally To $900 Resistance

How to Combine Fundamental and Technical analysis effectively
There’s a debate in the world of trading and portfolio management: Is it better to focus on fundamentals or take a technical-analysis tack?
Opinions are strong, but the good news is that you don’t have to choose a side. In fact, the best traders know when to zoom in on price and when to zoom out and look at context. Thus, you can marry fundamental analysis with technical analysis to get a complete picture and more effectively manage your money. Taking this dual approach offers a framework that balances conviction with timing, spreadsheet data with chart trends. But where do you start?
A standard method is to begin with a fundamental screen—quantitatively sifting through equities to identify promising candidates based on their respective EPS growth, ROE percentage, debt profile, or level of free cash flow. Once you have whittled the output of stocks down to a manageable level, perhaps 10 names, you can then turn to the charts to call out key support and resistance price zones, namely entry and exit prices.
This technique fits a variety of investor types and time horizons. Swing traders might emphasize earnings growth and momentum, while long-term investors usually weigh fundamentals more. Day traders might give fundamental indicators like macro context or news a quick look—or skip them entirely—in favor of technical signals.
Financials Sector ETF (XLF) Jumps on Fundamental Election-Outcome News, Continuing the Technical Trend Higher

A Practical Example
One way to combine fundamental and technical analysis is to set a directional view.
For example, suppose you side with the bulls after assessing macro barometers, such as GDP growth, inflation trends, geopolitical happenings, consumer spending, and fiscal and monetary policy. You view the market as being undervalued based on real data.
You performed due diligence and found that the Information Technology sector had the best EPS growth among the 11 S&P 500 sectors. So, you decide to investigate the fundamentals of NVIDIA (NVDA).
Based on your fundamental analysis and valuation assessment, you determine that the stock is 20% undervalued. Before you buy shares, though, you examine the chart. You notice that the stock periodically drifts down to the 200-day moving average. So, you place a limit order to buy shares 2% above that trend-indicator line, with a stop-loss order 10% below it.
That risk management strategy combines economic and firm-specific fundamentals with chart work. But your job as your own portfolio manager is not done. It’s critical that you refresh your valuation and constantly monitor technical trends as long as you own the stock—buying is often the easy part; selling can be tougher for even highly skilled traders.
A key risk is becoming overly dogmatic in one modus operandi over the other. Only studying company fundamentals while splitting hairs with your valuation could neglect important information that technical market price patterns may tell. In a similar vein, just eyeing price action could result in holding extremely over-valued stocks or perhaps overweighting a cyclical sector most at risk from emerging recession risks.
Ultimately, the fusion of both disciplines can offer traders optimal timing techniques, deeper conviction, and improved risk-adjusted returns.

Mike is a CFA® charterholder and Chartered Market Technician® with a background in trading, risk management, and financial education. He brings years of experience writing about markets, investing, and retirement planning for a broad audience.