What are Trading Volumes? (With Simple Examples)


Volume is one of the most widely observed — and often misunderstood — data points on a stock chart. While price shows where the market is moving, volume reveals how much participation is behind that move.
Traders use volume to assess conviction. When a breakout occurs, volume helps confirm whether the move is supported by real interest or is likely to fade. During trends, it provides signals of strength or fatigue. And at turning points, volume often shifts before price does.
This article explains how volume in trading works, how to interpret it across different contexts, and how to apply it to your strategy. You’ll also find real-world examples to illustrate how volume can support your decision-making — without relying on guesswork.
Volume helps confirm price action. Rising volume adds credibility to breakouts or trends, while low volume can signal hesitation or potential reversal.
Price-volume relationships reveal market intent. Patterns like rising price with falling volume often point to weak moves or possible traps.
Volume is most useful when combined with structure. Support, resistance, and trendlines become more meaningful when volume aligns with them.
No volume indicator works in isolation. Tools like OBV or VWAP should support your analysis — not replace it.
Timeframe and context matter. Volume patterns on a 1-minute chart won’t behave the same as on a daily chart. Always adjust your interpretation to the setup.
What is volume in trading?
Volume is the number of trades that take place during a specific period. In simple terms, it shows how many units of an asset — like shares, contracts, or tokens — changed hands, and how active the market is during that time.
Most platforms display volume as vertical bars just below the price chart. Each bar represents the total volume traded during a specific time frame (like one minute, one hour, or one day). The taller the bar, the more activity there was during that candle.
Raw volume tells you how much activity occurred, but relative volume — how today’s volume compares to the asset’s average — is often more useful. A strong spike in relative volume can signal unusual interest or a potential shift in direction.
In forex, volume shows how often the price changes — not the number of trades — because there’s no central exchange. In crypto, some platforms show real trade volume, but the numbers vary depending on the exchange. In stocks, volume is fully tracked and reflects actual trades.
What volume really tells you
Volume gives you a clearer picture of what’s happening behind the price. It’s not a signal on its own — but it helps you judge whether the market is active, committed, or hesitant.
1. It tells you how liquid the market is
In other words, it is easy to buy or sell without seeing a transaction impacting the price.
- High volume usually means tighter spreads, smaller slippage, and faster order execution, making trading more efficient.
- Low volume, on the other hand, often leads to erratic price movements and worse fills, especially on larger position sizes.
Before looking for setups, it’s worth checking if the asset is liquid enough for your strategy. A good idea on a chart can quickly turn into a bad trade if there’s not enough market participants.
2. It helps you judge conviction
Volume adds context to price. A rising market with strong volume usually means buyers are active and engaged.
But if price moves without much volume behind it, there’s a chance the move could stall or reverse — especially near key levels, such as support and resistances.
The same logic applies to down moves: heavy selling pressure shows up through rising volume. A drop on weak volume might not hold.
3. It hints at shifting interest
Changes in volume can signal changes in attention. A sudden spike might reflect news, positioning, or a technical level that caught traders’ eyes.
On the flip side, fading volume during a trend can be a clue that momentum is slowing down.
These shifts don’t guarantee anything — but they often happen before bigger turning points.
4. A quick cheat sheet for volume and price
Here’s a basic framework traders use to interpret volume alongside price:
- Price ↑ + Volume ↑ = strong move
- Price ↓ + Volume ↑ = strong selling
- Price ↑ + Volume ↓ = weak rally
- Price ↓ + Volume ↓ = potential bottom or slowdown
It’s not a strict rule — but it helps you read whether the market is building momentum or running out of steam.
How to Use Volumes in Trading
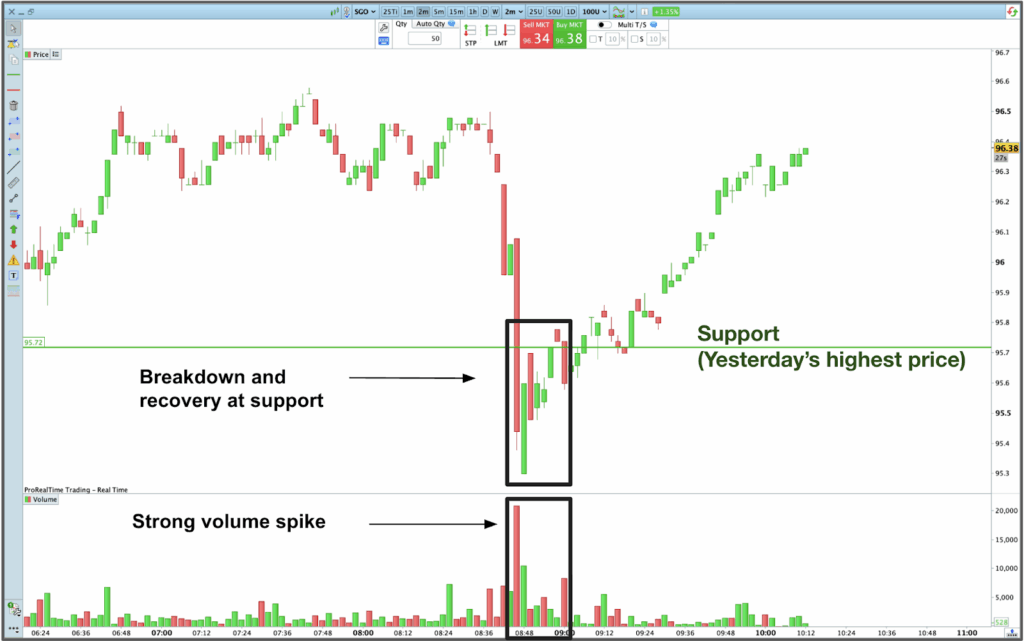
Use volume to confirm support and resistance levels
Support and resistance levels are only useful if the market respects them. Volume helps you figure that out.
When price approaches a key level, rising volume is a sign that traders are reacting. That activity suggests the level matters — and increases the chance of a technical bounce or rejection.
But if volume stays low, the level might not hold. It could mean there’s not enough interest to trigger a real move.
Before acting on a support or resistance zone, check the volume. If it’s rising, the level is likely in play. If not, it may be worth looking elsewhere.
Spot Real Breakouts vs Fakeouts
Breakouts happen all the time — but many don’t go anywhere. Volume helps you tell the difference.
When price pushes through a key level, rising volume shows that traders are stepping in. That participation supports the move and increases the chances of follow-through.
But if volume stays low, the breakout may not stick. Without enough interest behind it, the move can stall or reverse just as fast.
Now compare that to a breakout with strong volume.
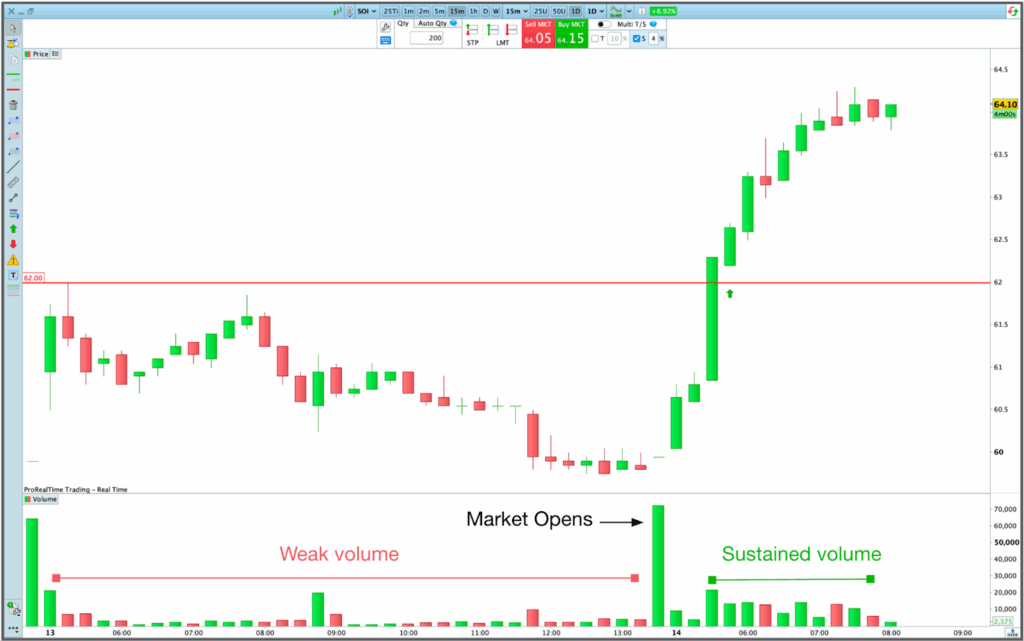
Once the breakout is in play, volume still matters. In strong trends, volume tends to remain elevated or even grow as the move builds. It shows there’s sustained interest behind the price action.
But if volume fades while price continues higher, momentum may be drying up. It’s not always a reversal signal — but it can be a sign to manage risk more tightly.
Volume won’t confirm every move. But used well, it helps you filter out weak breakouts — and spot when a trend still has room to run.
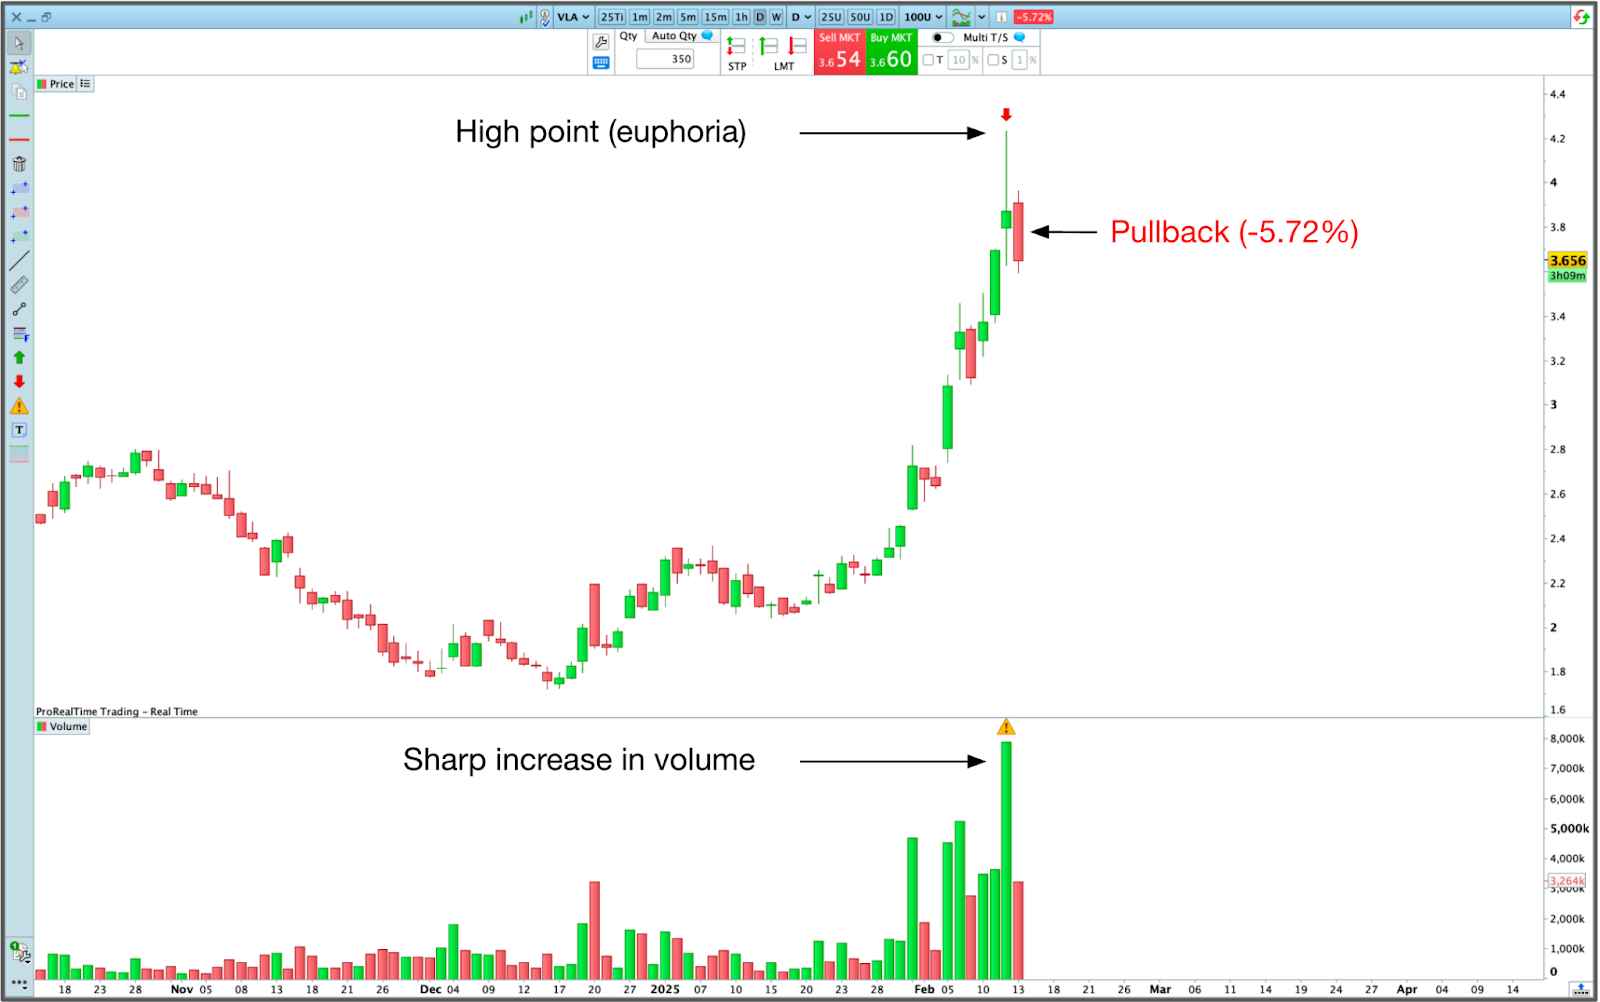
Catch Capitulation Moves Before the Bounce
Bull markets are born in panic and die in euphoria. At the extremes of both, volume often explodes — marking what traders call a capitulation.
A bullish capitulation usually happens at the top of a strong move, when short sellers give up and buyers pile in. Volume spikes, price surges, and then a correction follows.
A bearish capitulation is the opposite. It often occurs after a steep drop, when buyers finally give up and exit in panic. Volume spikes again — but this time, the selling dries up, and price begins to rebound.
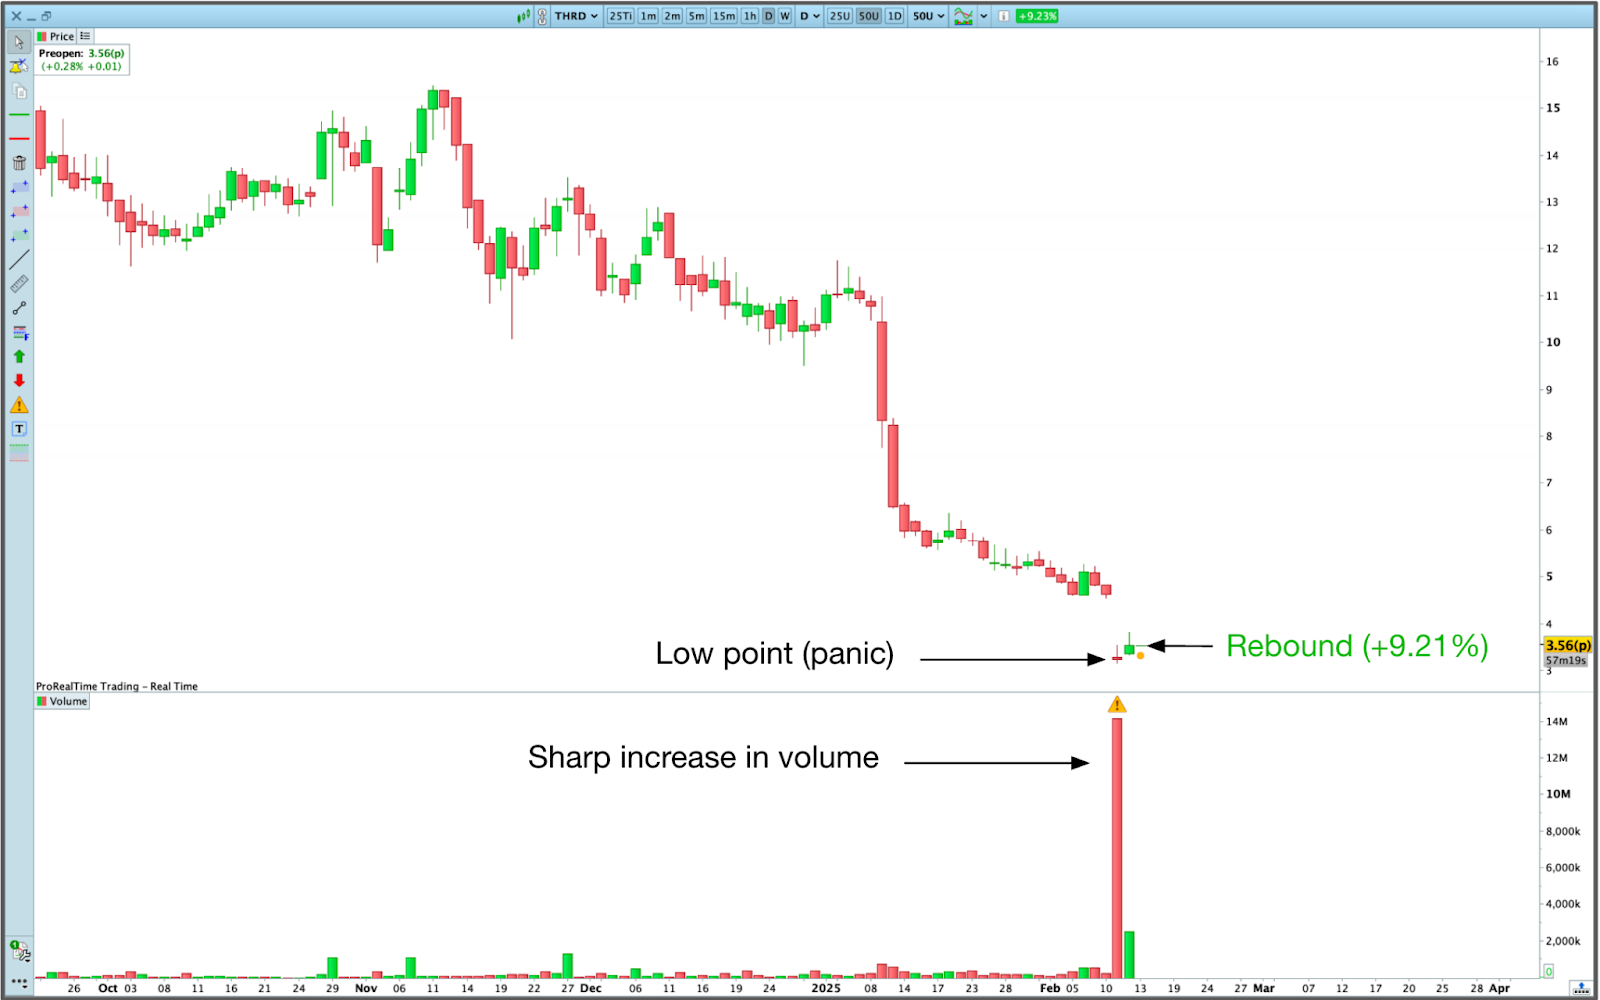
These moments aren’t always easy to trade in real time. But if you spot a volume spike after a sustained trend — and price stalls or reverses — it’s often a sign the move is exhausted.
Volume indicators
Raw volume alone can tell you a lot, but volume indicators help you go deeper. They smooth out the noise, highlight patterns, and reveal how volume behaves over time.
Here are some of the most popular ones:
| Indicator | What it shows | How traders use it |
|---|---|---|
| VWAP | Where the average traded price is during the session, weighted by volume | Used as a real-time reference to judge if price is strong (above) or weak (below); helpful for intraday bias and trade timing |
| OBV | Whether volume supports the price trend | Rising OBV with rising price = strong trend. Divergence (e.g. price up, OBV flat) can signal weakening momentum |
| A/D Line | Subtle buying or selling pressure based on close location within the candle | Confirms trend strength or exposes hidden pressure not visible from price alone |
| Volume Profile | Where the most trading happened at different price levels | Identifies zones that may act as support or resistance; useful for planning entries and exits |
Other volume-based indicators you may come across include the Money Flow Index (MFI), Chaikin Money Flow (CMF), and the Klinger Oscillator. These are less commonly used by beginners but show up on many platforms and can be explored as you gain experience.
In practice, most experienced traders use 1 or 2 indicators — often just to confirm what they’re already seeing on the chart.
They rely more on:
- Price action
- Key levels (support/resistance, previous highs/lows)
- Volume behavior (spikes, fades, surges around levels)
Indicators are there to support your read, not drive it. When you start stacking too many, the chart becomes confusing — and your decision-making slows down.
How to use volume in your own trading strategy
Volume works best when it supports your setups, not when it becomes the setup. The key is to use it as a filter, not a crutch.
Here’s how to make it part of your process:
1. Start with a simple checklist to confirm your setups
Before entering a trade, ask:
- Is volume rising at key price levels?
- Is the spike meaningful, or just random?
- Does volume align with the price direction?
These small checks help filter out low-conviction moves.
2. Use volume to find what the market is watching
A sudden increase in volume often means something just happened — news, a breakout, or a key level being tested. These spikes can help you focus on assets that are active and worth watching.
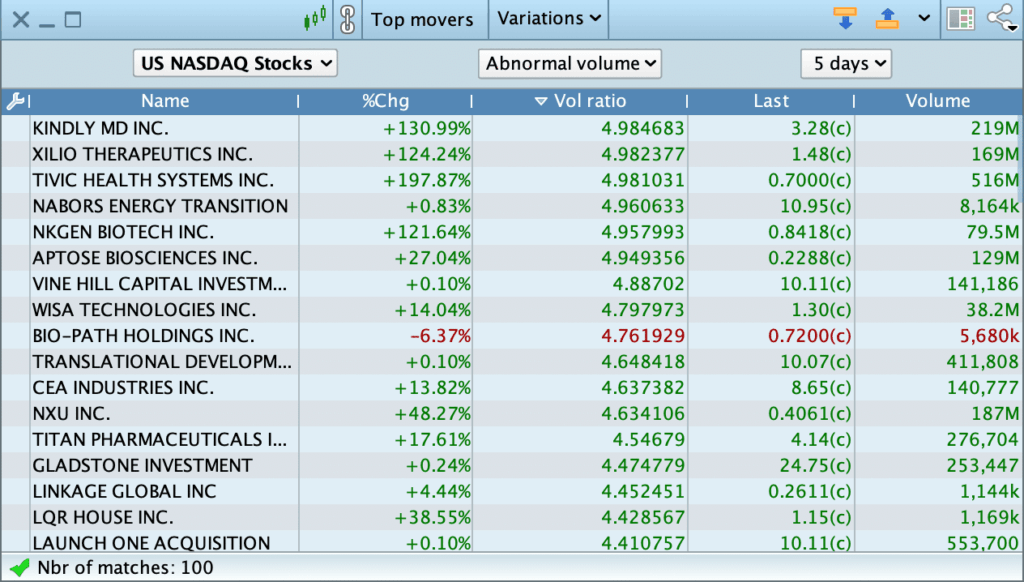
3. Set alerts or use screeners to stay ahead
You don’t need to stare at charts all day. Use a screener to spot stocks with abnormal volume, or set alerts to notify you when volume crosses a key threshold. It’s a simple way to catch setups as they form.
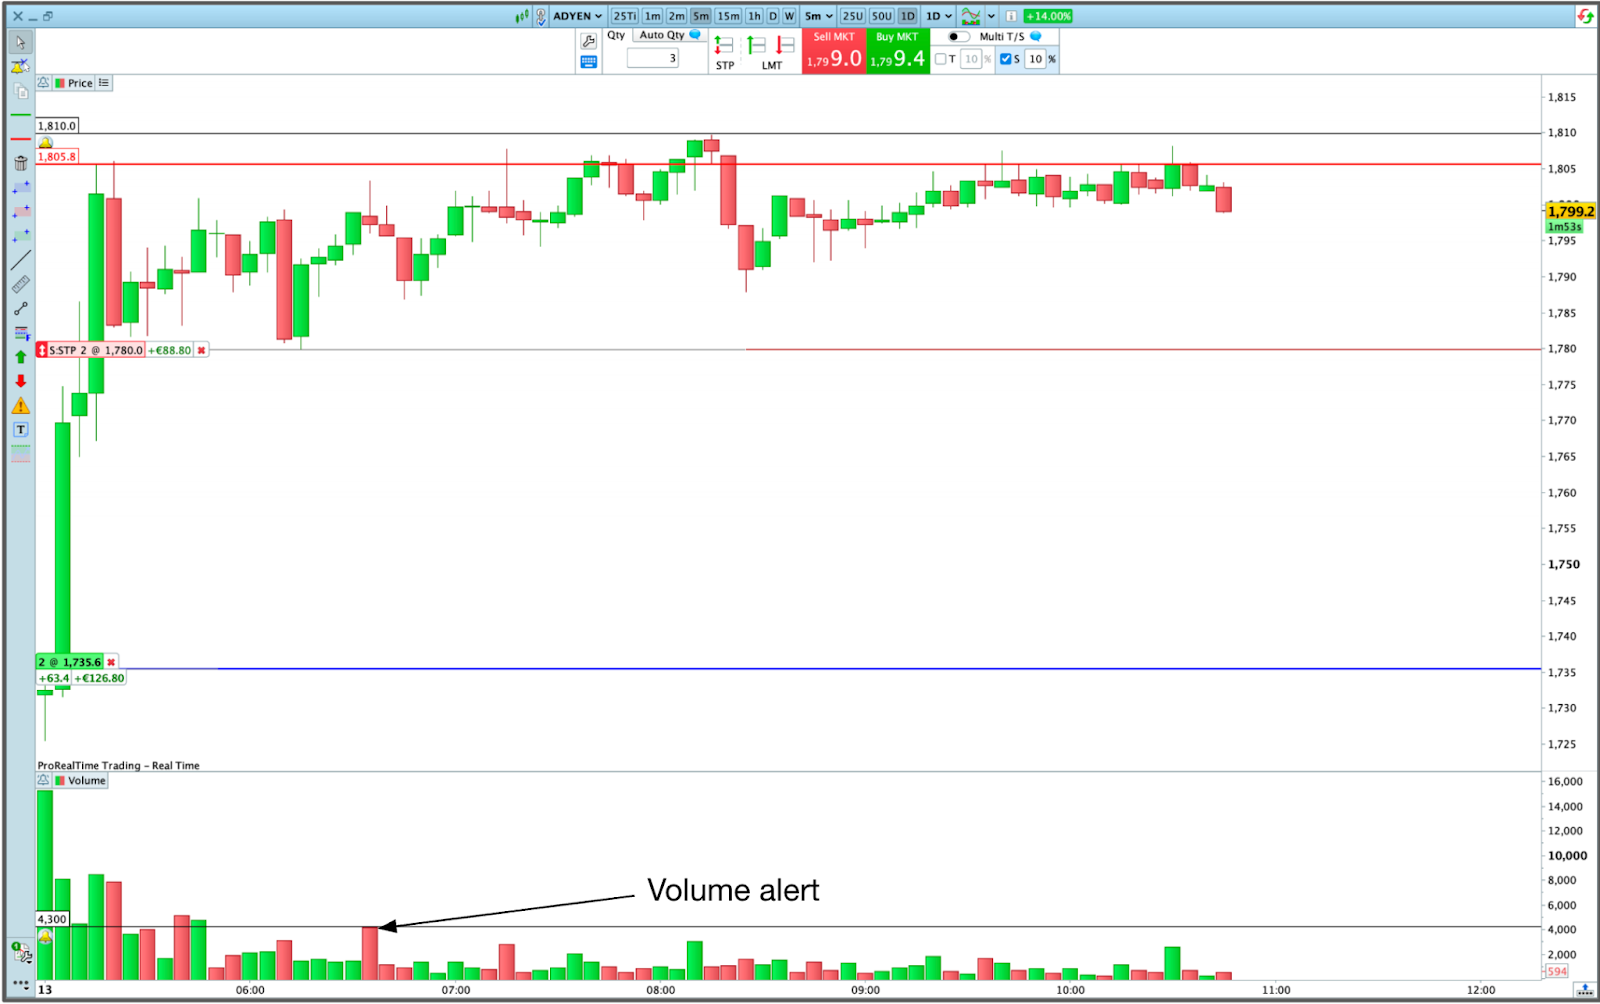
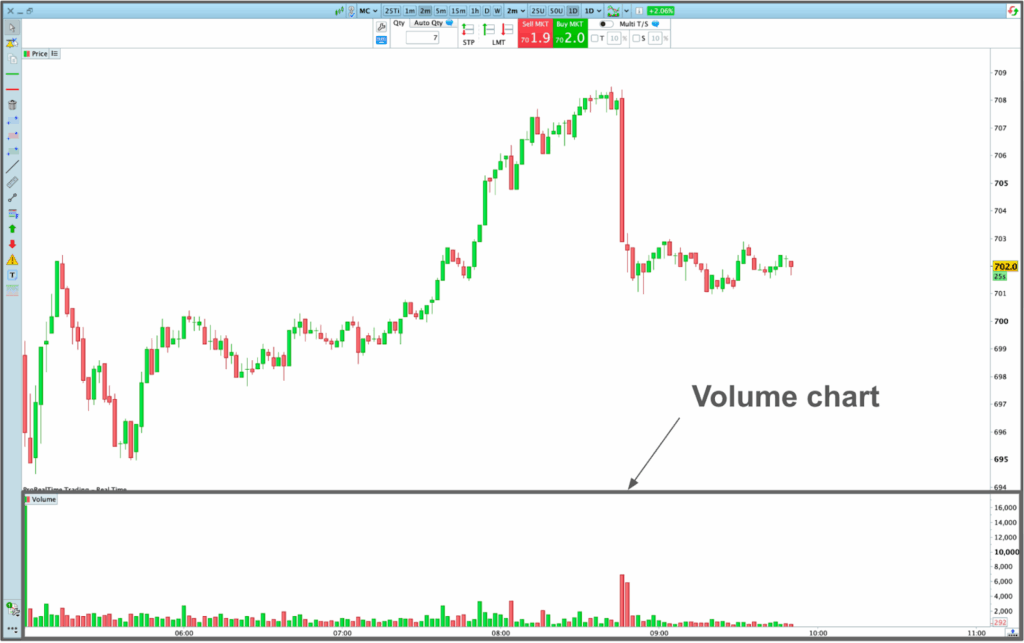
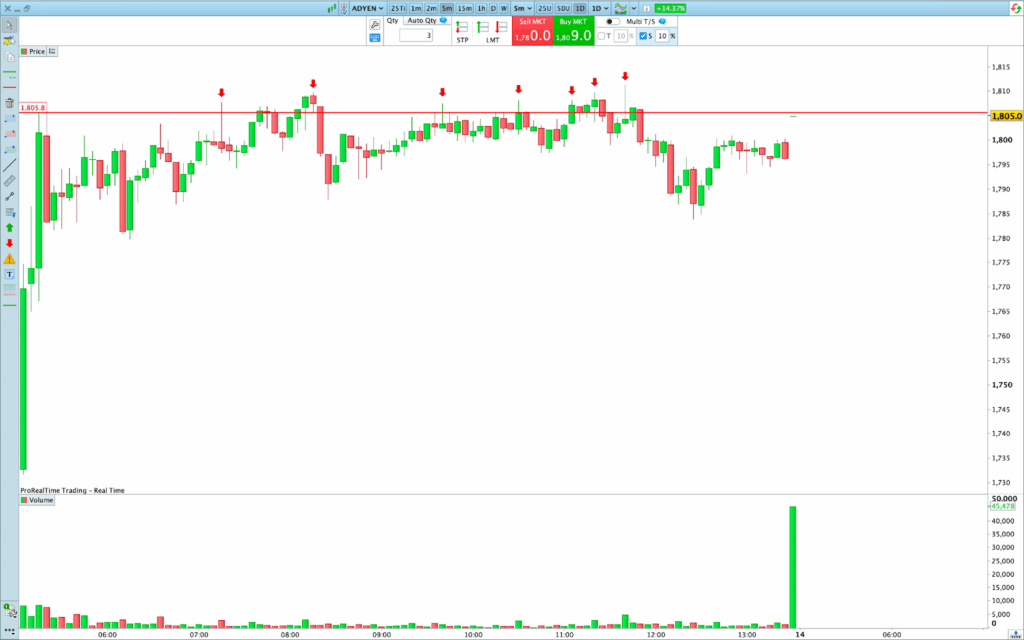
Alert set on the volume peak following the first trading session – ProRealTime
4. Combine volume with price action — not instead of it
Volume tells you how much interest there is. Price tells you what the market’s actually doing. You need both. A clean setup backed by strong volume is worth more than either alone.
5. Adapt your read to the time frame
Volume on a 1-minute chart can be noise. On a daily chart, the same spike might signal serious interest. Always match your volume read to the timeframe you’re trading.
6. Know when volume can be misleading
Some conditions distort volume signals:
- Pre-market or illiquid assets: low volume, wide spreads
- Hype-driven surges: volume can explode for the wrong reasons
- Post-news moves: volume is high, but direction is unclear
When in doubt, focus on clean, high-volume setups with structure.-
Final thoughts
If you’re trying to choose stocks for day trading, abnormal volume is one of the best filters you can start with.
Unusually high volume often points to stocks that are moving fast, reacting to news, or testing key levels. It’s where volatility, risk, and potential profit all show up — and sometimes, where even well-planned trades go sideways.
Volume won’t guarantee a good outcome. But it helps you pay attention to the right places

Othmane has been swing trading for years and builds on experience in investment banking. He writes regularly about trading and market analysis, and has passed Level I of the CFA Program along with earning a double Master’s degree in Financial Analysis.
Enjoy free trading practice on
ProRealTime Paper Trading Simulator.