PRT Bands: ProRealTime’s Trend Indicator Explained


When you’re trend-following, the hardest part isn’t spotting a trend. It’s managing your position once you’re in it.
Two mistakes come up again and again: cutting a winner too early while it’s still climbing, or jumping into a falling stock before it’s found its floor. PRT Bands was built to help you identify bullish and bearish price setups more precisely.
PRT Bands at a glance
PRT Bands automatically plots a channel around the price. That channel turns green in an uptrend and red in a downtrend.
The concept is simple: the bands mark the “normal” range of price behaviour. As long as the price stays inside, the trend holds. Once it breaks out, the trend is in question.
The tool is built directly into ProRealTime, with no installation or setup required.
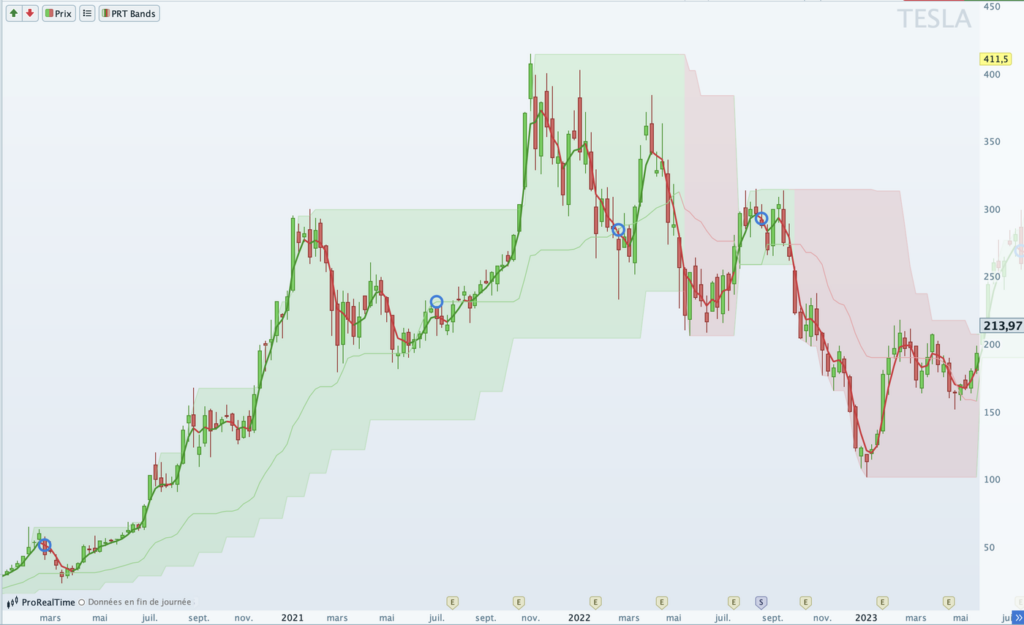
PRT Bands on Tesla, weekly chart: the channel turns green in an uptrend and red on the reversal.
Where does PRT Bands come from?
Beyond standard indicators, ProRealTime includes tools built by well-known traders. PRT Bands is a good example.
The indicator was originally called TrendFrance. Its creator, Christophe Sangouard, is an independent French trader specialising in trend following and the author of a technical analysis course, InvestirZen (French-language).
He chose ProRealTime for its programming language, which is both accessible and powerful and lets you code custom indicators and screeners. He also values the ProRealCode ecosystem built around the platform.
In 2020, ProRealTime acquired the indicator and made it a native part of the platform, under the name PRT Bands, alongside standard tools like MACD and Bollinger Bands. [1]
What is PRT Bands used for?
PRT Bands “keeps your brain on rails”. Traders follow a visual rule rather than gut instinct or cognitive biases, which helps avoid buying into a stock that’s still locked in its red bearish channel.
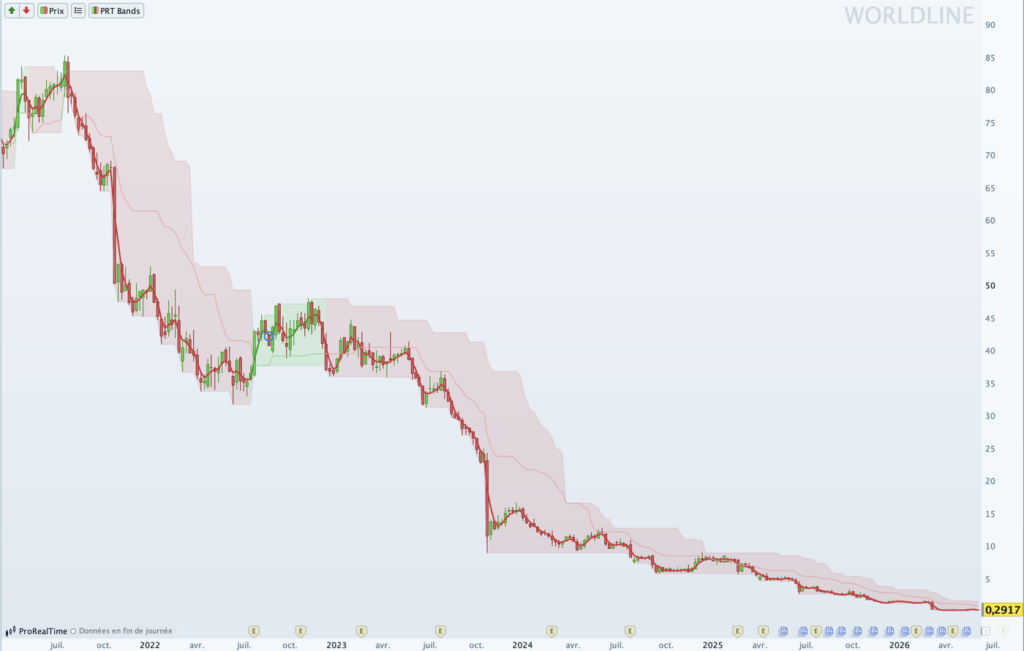
PRT Bands on Worldline: the channel stays red throughout the decline, keeping traders away from a falling knife.
In practice, the indicator helps answer a few key questions:
- What’s the current trend? Reading the state of a trend is one of PRT Bands’ core functions: green channel means the asset is bullish; red means bearish.
- Is an uptrend forming? A shift from red to green signals a possible bullish reversal.
- Have we actually hit the bottom? As long as the channel stays red, the reversal isn’t confirmed. That’s the safeguard against catching a falling knife.
- Where to enter the trend? Once the uptrend is established, a recovery in the short-term line after a pullback helps identify an entry point.
How to read PRT Bands
The indicator overlays several pieces of information on the same chart. Here’s how to read them.
Reading the trend
| Element | What it shows | How to read it | |
|---|---|---|---|
| 1 | Channel boundaries | The “normal” range of price behaviour | Breakout above a red channel = reversal; drop below the lower band of a green channel = trend in question |
| 2 | Channel colour | The trend direction | Green = bullish, red = bearish |
| 3 | Short-term line | Recent price movement | Recovers after a pullback = potential entry point |
| 4 | Medium-term line | The underlying trend | Crossed below by the short-term line = momentum fading; crossed above = recovery |
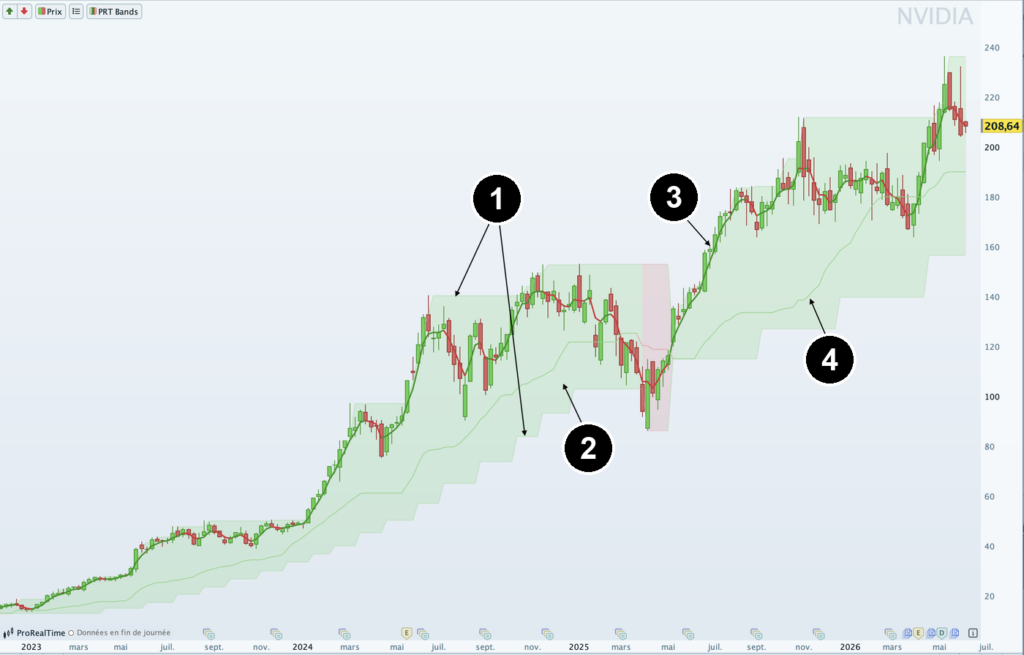
The components of PRT Bands: 1. channel boundaries, 2. channel colour, 3. short-term line, 4. medium-term line.
Measuring and assessing the trend
| Element | What it shows | How to read it | |
|---|---|---|---|
| 5 | Percentage performance | Progress since the start of the uptrend | The distance covered at a glance |
| 6 | Bullish thresholds | Uptrend milestones (numbered lines) | New threshold confirmed after 40 consecutive closes above it |
| 7 | Speed curves (×5) | The trend’s pace | Near the upper curves = fast; lower curves = slow |
| 8 | Blue circles | Weakening zones | Consider taking partial profits |
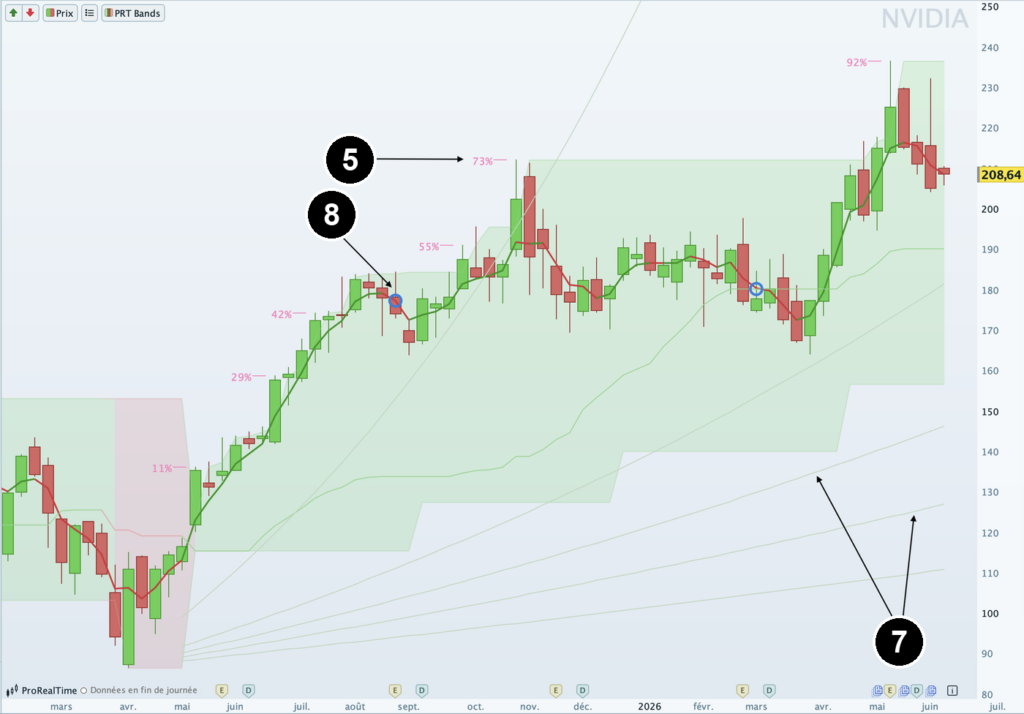
Percentage mode: 5. performance in %, 7. speed curves, 8. blue circles.
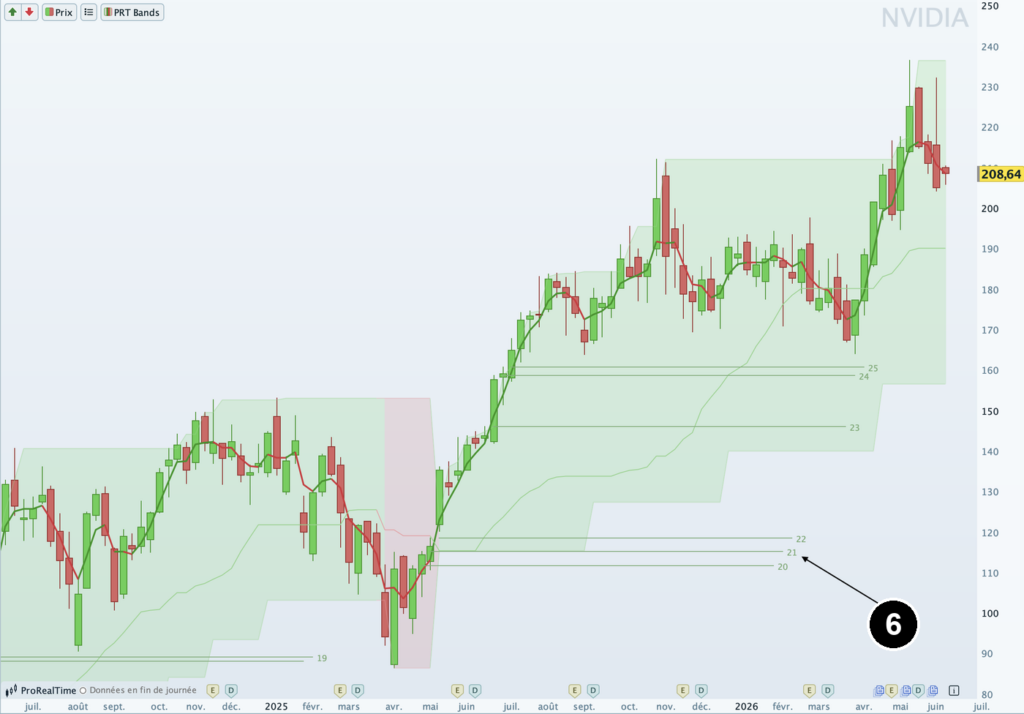
Bullish thresholds mode: 6. uptrend milestones, shown as numbered horizontal lines.
The technical description of the indicator draws on the official ProRealTime manual. [2]
How to use PRT Bands: step by step
Displaying PRT Bands
The indicator is free on both ProRealTime Web and the full desktop software. Click the “Price” label in the top left of the chart, open “Add an indicator”, and select “PRT Bands” from the built-in list. Right-clicking the chart or using the “Indicators” button at the bottom of the window takes you to the same menu.
To adjust the display settings, click the “PRT Bands” label and then “Configure”.
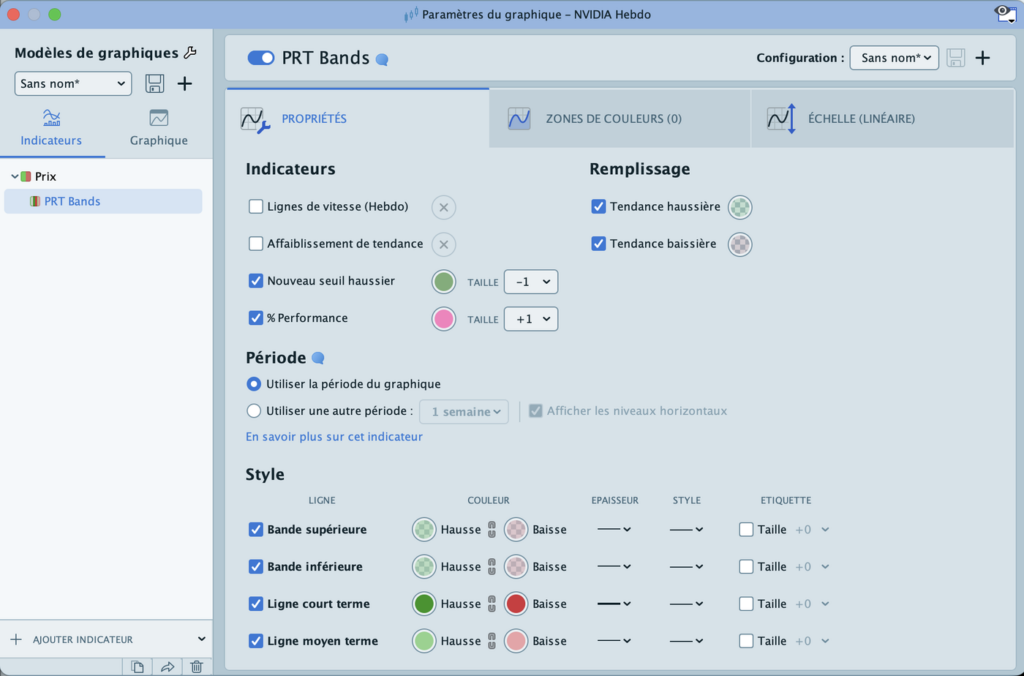
The PRT Bands “Configure” panel, where you choose between percentage and threshold display.
Once the indicator is on the chart, here’s how to use it.
- Entry: wait for green. As a rule, you don’t enter a position while the channel is red. The buy signal comes when the channel turns green, as the price breaks above its bearish channel. The short- and medium-term lines help you fine-tune the entry point.
- Position management: hold as long as the channel is green. Once in, let it run. Pullbacks that stay inside the channel are normal price behaviour and don’t justify an exit, unless you want to take profits or your strategy calls for it. The bullish thresholds and speed curves help you judge whether the trend still has momentum.
- Exit: start scaling out when momentum fades. Blue circles and the short-term line crossing below the medium-term line signal exhaustion. That’s the moment to consider taking partial profits. The definitive exit signal is the channel turning red.
PRT Bands is a decision-support indicator. It is not a predictive tool and it is not infallible. Markets remain unpredictable, and a trend can reverse at any moment, leading to significant losses in your portfolio.
PRT Bands vs. other trend-following indicators
PRT Bands is a trend indicator based solely on price. Other trend-following indicators incorporate momentum, volatility, or trend strength. Here are four others worth knowing.
| Indicator | Definition | What it adds over PRT Bands | Limitations |
|---|---|---|---|
| MACD | Difference between two exponential moving averages, with a signal line and histogram | Adds momentum and divergences | Lagging; false signals in ranging markets; no price levels |
| SuperTrend | Line based on the ATR that flips above or below the price and changes colour | Incorporates volatility and gives a quantified trailing stop, in both directions | Whipsaws in choppy markets; slow to react to sharp reversals |
| ADX / DMI | Measures trend strength from 0 to 100 (above 25 = established trend), with +DI and -DI for direction | Tells you whether a trend worth following exists, and when to stay out | No price levels or entry signals; lagging; a high ADX doesn’t indicate direction |
| Ichimoku | Five-line system forming a cloud (Kumo) projected into the future, based on high/low midpoints | Shows projected support/resistance levels and a multi-timeframe view | Dense to read at first; hard to interpret in high volatility |
PRT Bands sticks to a clean read of the trend, while these technical indicators each add an extra dimension (momentum, volatility, strength…).
The limits of PRT Bands
PRT Bands is deliberately minimalist: it reads a single data point, the price. That’s what makes it clean, but it also sets its limits.
- It’s built for long trades. PRT Bands does show bearish phases (red channel), but its job is tracking and following uptrends.
- It’s suited to daily and weekly charts. On intraday timeframes, the signal loses its relevance.
- It loses reliability in trendless markets. Without a clear direction, the channel flips frequently and the signals become hard to act on.
Christophe Sangouard himself described PRT Bands as incomplete for uncertain markets, in a 2021 interview. [3] That observation led him to develop a second indicator, ExtraTrend (paid), incorporating volume, volatility, and timing.
Going further: screeners and programming
Beyond the chart display, PRT Bands comes with four programming instructions in ProRealTime:
PRTBANDSUPandPRTBANDSDOWN(upper and lower channel boundaries);PRTBANDSMEDIUMTERMandPRTBANDSSHORTTERM(medium- and short-term lines).
You can use these to build custom indicators, or more usefully, screeners. For example, you could scan an entire market and filter for stocks where the price has just crossed the upper channel boundary, meaning they’re entering an uptrend.
For a swing trader monitoring hundreds of stocks on the weekly chart, that’s a significant time-saver.
FAQ
Is PRT Bands free?
Yes. It’s built directly into ProRealTime and free to use, including on the web version.
Which timeframe works best?
Daily or weekly charts, for a medium-to-long-term approach. It’s not well-suited to intraday trading.
Does PRT Bands work in a bear market?
It shows bearish phases (red channel), but it’s designed to detect and follow uptrends.
Should you combine it with other indicators?
Not required, but since PRT Bands focuses on price alone, a momentum tool (MACD) or trend-strength measure (ADX) can complement its signal.
PRT Bands is one of the highlights of this French trading platform. For a fuller picture of what ProRealTime has to offer, read our ProRealTime review.

Maxime holds two master’s degrees from the SKEMA Business School and FFBC. As founder and editor-in-chief of NewTrading.fr, he writes daily about financial trading.
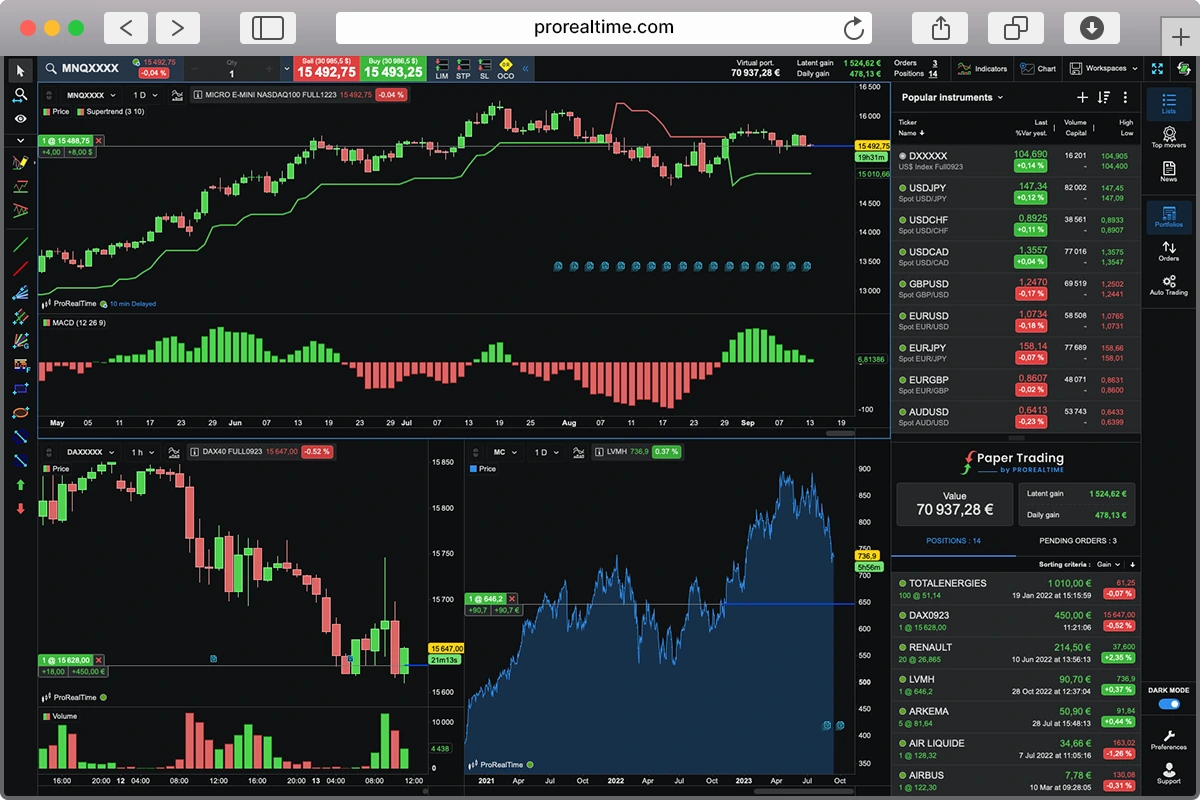
Enjoy free trading practice on
ProRealTime Paper Trading Simulator.