Trading Inverse Head and Shoulders Patterns

The inverse head and shoulders pattern is particularly valued for its reliability as a bullish reversal signal. This formation, defined by an inverted head flanked by two shoulders, frequently indicates the end of a downtrend and the potential for a price uptrend.
Inverse head and shoulders are among the most popular patterns. Traders use them to take profits and bet on rising prices at the end of a downtrend.
Inverse head and shoulders patterns are bullish reversal patterns consisting of a middle trough (the head) and two lateral troughs to either side (the shoulders).
The two low points between the head and shoulders form the neckline, which acts as a support level. To estimate the potential price increase, measure the distance from the head (the highest point) to the neckline. Then, add this distance to the breakout point on the neckline to calculate the expected upside target.
Inverse head and shoulders patterns encourage investors to buy and short sellers to take profits.
What are inverse head and shoulders patterns?
Inverse head and shoulders patterns are bullish reversal patterns consisting of three consecutive troughs, with the middle trough (the head) dipping lower than the two lateral troughs (the shoulders).
This pattern illustrates a gradual shift in the balance of power between buyers and sellers, with the downward trend slowing down. The right shoulder forms when the downtrend weakens, and prices do not fall below the low established by the head.

In a typical downward trend, prices first drop to a low point before rebounding to a resistance level, forming the left shoulder. The downtrend resumes, creating a deeper low, which constitutes the head.
Prices then return to the first high point (resistance level) between the first two low points, called the neckline resistance level.
However, the downward trend loses steam and downward price momentum is blocked by the support level represented by the bottom of the first shoulder. A third and final trough draws the right shoulder.
The pattern’s bullish signal is confirmed when prices break through the neckline resistance level after forming the right shoulder.
The neckline is also crucial for calculating the theoretical upside price target, which is determined by measuring the distance from the head (the lowest point) to the neckline and adding this distance to the neckline breakout level.
The pattern and its bullish signal are invalidated if, after breaking the neckline resistance, prices fall back below the low of the right shoulder.
How to identify inverse head and shoulders patterns
| Features | Explanations |
|---|---|
| Previous downtrend | Before the inverse head and shoulders pattern forms, prices follow a clear downward path, marked by lower lows and lower highs, reflecting a strong bearish trend. |
| Left shoulder | The first dip creates the left shoulder. It’s a temporary low, soon overtaken by another, more aggressive bearish push. |
| Head | The second and deepest dip forms the head, sinking below the previous low, and signaling the possible exhaustion of the downtrend. |
| Right shoulder | The final dip creates the right shoulder, roughly matching the depth of the left shoulder, indicating a possible bottoming out. |
| Primary support level | The lowest point of the pattern—the head—serves as the crucial support level, where buying interest starts to build. |
| Secondary support level | The two higher troughs (the shoulders) act as additional support levels, reinforcing the pattern’s structure. |
| Neckline (resistance level) | The two high points to either side of the head are the resistance level, referred to as the neckline. |
| Time scale | This pattern can unfold over any time frame, from minutes to weeks, making it adaptable to different trading strategies. |
| Volume | Watch for a surge in trading volume as prices approach the neckline; a breakout with strong volume often confirms the bullish reversal. |
Steps for spotting inverse head and shoulders patterns:
1 – Start by identifying a clear downward trend in the market. This sets the stage for the potential reversal that the inverse head and shoulders pattern indicates.
2 – Keep an eye out for three consecutive dips, where the middle one (the head) falls lower than the other two (the shoulders). These shoulders should be roughly the same height.
3 – After the right shoulder forms, pay close attention as the price approaches the neckline—the line connecting the two peaks on either side of the head. When the price breaks above this neckline, it confirms the inverse head and shoulders pattern, signaling a potential buying opportunity.
How to trade inverse head and shoulders patterns
Traders usually bet that prices will continue to rise once they cross the neckline resistance level. A stop-loss order is placed below the support level represented by the shoulders’ low points, and a take-profit order is placed between the low point (the head) and the neckline resistance level.
| Position | Buy |
| Position entry point | After prices cross the neckline resistance level |
| Stop-loss | Below the second shoulder’s low point |
| Take-Profit | Between the low point (the head) and the neckline resistance level |
Example of an inverse head and shoulders pattern
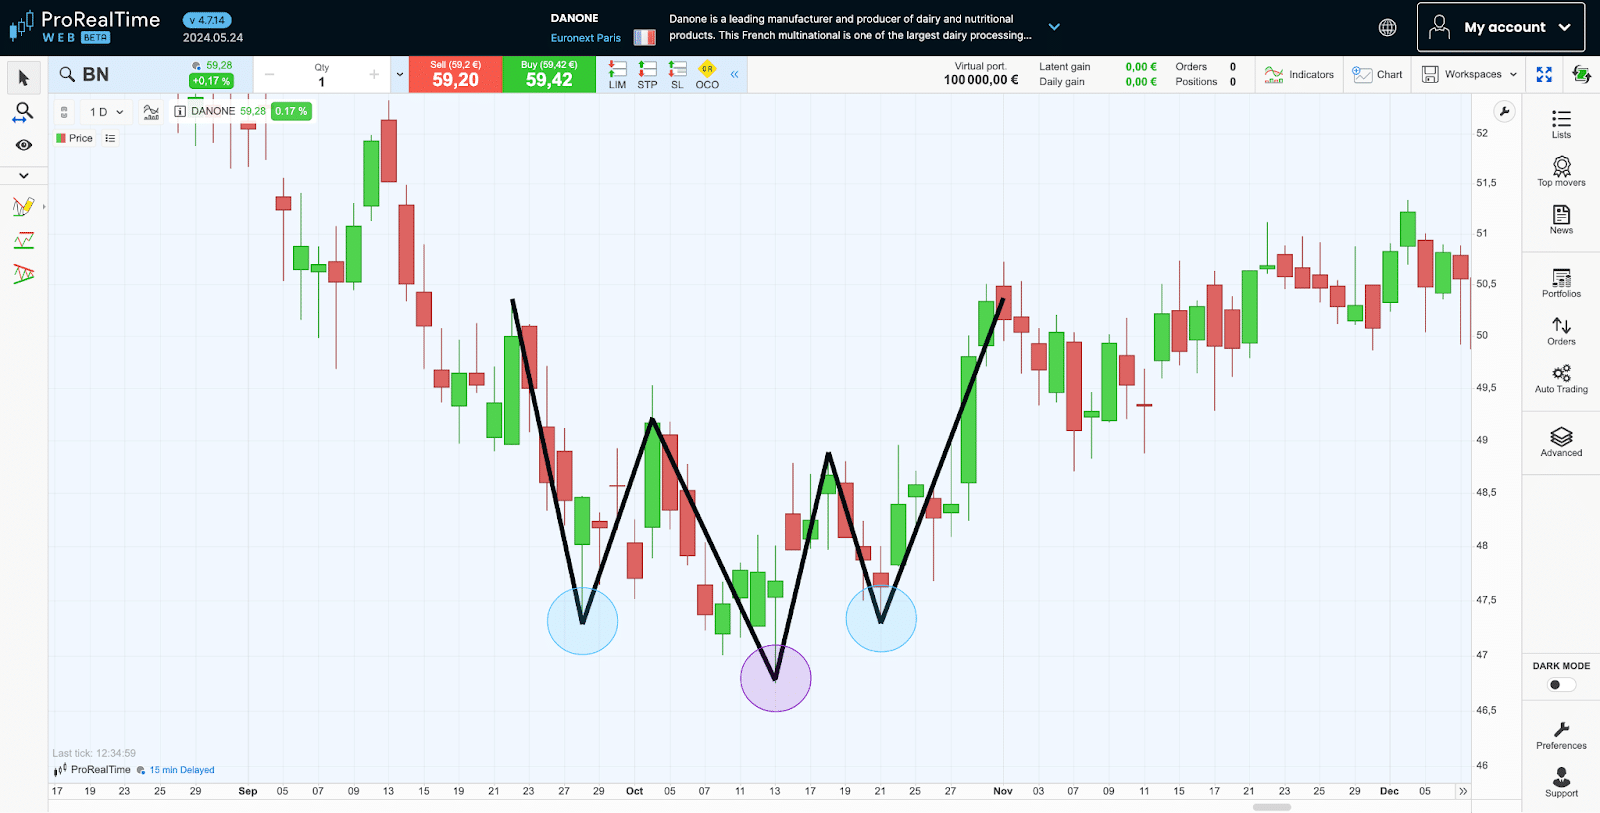
In this example, DANONE’s share price draws an inverse head and shoulders pattern.
You see three troughs, with the middle one (the head, in purple) lower than the two smaller troughs to either side (the shoulders, in blue). Once the shape is formed, the downward trend ends, and a new upward trend emerges.
The probability of success for inverse head and shoulders patterns.
The inverse head and shoulders pattern is not a sure thing (far from it), and its presence alone is insufficient to provide traders with a significant statistical advantage. Therefore, inverse head and shoulders patterns should be interpreted more broadly.
Furthermore, the accuracy of inverse head and shoulders patterns is often imperfect. In fact, it is common to see the second shoulder slightly higher or lower than the first due to market noise.
Head and shoulders patterns: How do they differ from inverse head and shoulders patterns?
Head and shoulders patterns are the exact opposite of inverse head and shoulders patterns.
In other words, head and shoulders patterns are bearish reversal patterns consisting of three consecutive peaks with the middle peak (the head) rising higher than the two peaks to either side (the shoulders).
While inverse head and shoulders patterns send a buy signal at the end of a downtrend, head and shoulders patterns send a sell signal at the end of an uptrend.
Inverse head and shoulders patterns are rarely perfectly geometric. Therefore, it can take a little time and practice to be able to identify them.
Consider using one of the best trading simulators to teach yourself to trade inverse head and shoulders patterns with no risk.

Maxime holds two master’s degrees from the SKEMA Business School and FFBC. As founder and editor-in-chief of NewTrading.fr, he writes daily about financial trading.


7 Popular Swing Trading Strategies with Practical Examples


The Most Popular Chart Patterns in 2026