A Practical Guide to Algorithmic Trading (for Beginners)


Looking to build an automated trading strategy but not sure where to start?
You’re in the right place. Whether you already trade with clear rules or you’re just starting to think in systems, this guide will show you how to turn a strategy into something your platform can execute automatically.
According to research, over 60% of trades in major markets are now executed by algorithms. And it’s not just institutions anymore—retail traders are using automation to cut down on hesitation, reduce manual errors, and stick to their plans.
In this guide, we’ll dive on how to design a rule-based strategy, test it properly, and automate it using modern tools. Whether you use code or go no-code, you’ll come away with a process you can actually apply.
Let’s get started.
What You Need to Get Started
You need three things: a strategy with clear rules, a platform that can automate it, and a way to test it properly.
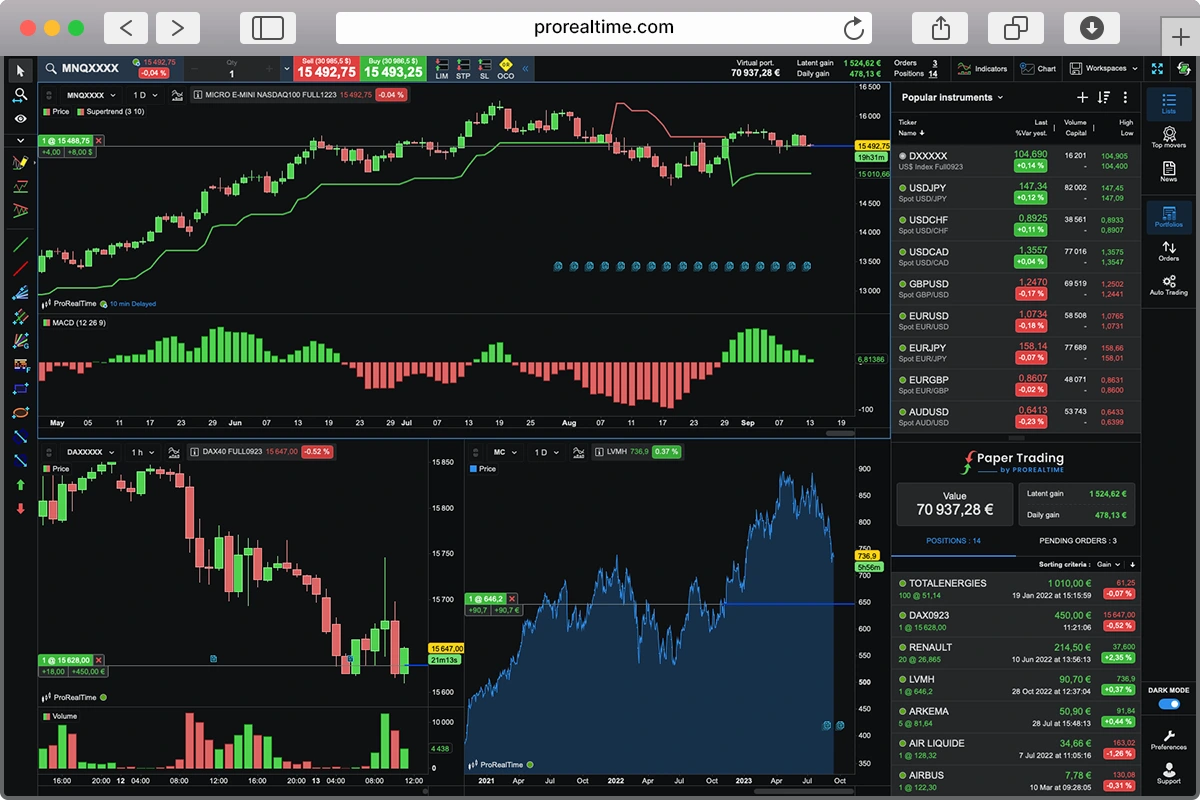
Most trading platforms—like ProRealTime or TradingView—bundle all of this together.
You can build, automate, and backtest your strategy in one place, often with visual builders so you don’t need to code.
The one thing you can’t skip is your strategy. It must follow specific, repeatable logic you can describe in plain language. If your approach relies mainly on gut feel or watching the market live, it won’t translate to automation.
And if you do decide to go deeper, tools like AI-assisted scripting make it easier than ever to customize or write logic without starting from scratch.
Understanding How Algorithmic Trading Works

Algorithmic trading consists of three key components: your strategy, the execution engine, and the feedback loop. First, you translate your trading idea, say:
- Buy when the 50-day moving average crosses above the 200-day moving average
This has been moved into a clear set of rules.
Next, your platform or custom code watches the markets in real time and sends orders the instant your rules trigger.
Finally, you monitor performance, tweak parameters to improve results, and then let it run again. That cycle of “define, execute, evaluate” keeps your system honed and responsive without you staring at charts all day.
The beauty of automation is in its consistency and speed. Your algorithm never gets jittery when markets get choppy, never second-guesses itself at night, and can submit orders in milliseconds, faster than any human clicking buttons.
By stripping out emotions, you stick to your plan through rallies and crashes alike, avoiding those gut-wrenching moments when you bail out too early or hold on for too long. Plus, once it’s set up, you can backtest across years of data in minutes to see how your idea would’ve fared before risking real cash.

Of course, algorithms aren’t magic. They can suffer from blind spots, patterns they weren’t programmed to recognize, and you might overfit by optimizing to past quirks that never repeat.
Technology can glitch, servers can go down, and big, unexpected “black swan” events can blow your model apart in seconds. It’s easy to fall into the illusion of certainty, that is because a backtest looks shiny, and the future is guaranteed.
That’s why, even when you automate, you need risk controls, real-time monitoring, and humility: the market always has the final say.
Pros and Cons of Algorithmic Trading
| Pros | Cons |
|---|---|
| Consistency– Always follows your rules without hesitation | Blind Spots– Misses market nuances or patterns it wasn’t programmed to catch |
| Speed– Executes orders in milliseconds, faster than manual clicks | Overfitting– Tuning to tightly to historical data can lead to poor live results |
| Objectivity– No emotional or psychological biases | Tech failures– Server crashes, connectivity issues or software bugs can halt trading |
| Reduced emotional decision-making– Avoids gut-wrenching mistakes | Black-Swan Vulnerability– Unforeseen events can blow models apart instantly |
| Rapid backtesting– Test years of data in minutes | Illusion of Certainty– Shiny backtests don’t guarantee future performance |
| 24/7 market monitoring– Unattended markets and time zones covered | Systematic Risk– Error in one (1) model can scale losses rapidly without human check |
| Scalability– Run multiple strategies or markets in parallel | Ongoing Maintenance– Needs continuous monitoring, risk controls and periodic tweaks |
Tools to Build and Automate a Strategy
No-code platforms like ProRealTime are a dream for traders who’d rather drag-and-drop than code. With its visual strategy builder you literally click on indicators, choose your entry and exit rules from a wizard, and snap them together like puzzle pieces.
Want to buy when RSI crosses above 30 and the price closes above a moving average?

Just pick those blocks, set your parameters, and ProRealTime turns it into an actionable system behind the scenes.
It’s perfect if you’re still wrapping your head around programming concepts or if you simply want to focus on refining ideas without wrestling with syntax.
When you’re ready to level up, platforms that let you write your own scripts open a whole new world.
cTrader offers C#-based scripting for custom indicators and bots, while MetaTrader’s MQL language has been a staple for Forex aficionados for years.
NinjaTrader combines a C# environment with powerful back- and forward-testing tools, and many traders eventually graduate to Python, hooking libraries like ccxt (mainly for crypto) or broker-specific APIs to build truly bespoke systems.
Once you’ve mastered a bit of code, you’ll find infinite flexibility, everything from advanced money-management routines to machine-learning filters at your fingertips.
Building Your First Simple Strategy
A “simple” strategy is really just a handful of clear, repeatable rules, nothing too fancy. Think moving‐average crossovers, that is:
Rule: Buy when the fast MA crosses above the slow MA
Rule: sell when it flips back,
Or RSI thresholds,
Rule: Enter long when RSI dips below 30,
Rule: Exit when it climbs above 70,
Or even a basic breakout confirmation,
Rule: Go long when the price closes above last week’s high.

The point isn’t to catch every twist and turn in the market, but to lay down a framework you can understand, test, and tweak without getting lost in complexity.
In ProRealTime you’ll lean on Assisted Creation, its visual strategy builder, to string together these rules in a flowchart‐style interface.
You drag “blocks” for indicators (like Moving Average or RSI) onto your canvas, hook them to “condition” blocks (e.g. Fast MA > Slow MA), and then attach “order” blocks (Buy or Sell).
It’s like Lego for trading logic: you see exactly how each piece links, and you don’t need to write a single line of code.
Let’s build a classic 50/200 moving‐average crossover from scratch:
- Open ProRealTime and click “Automated Trading” → “Create New Strategy.”
- In Assisted Creation, drag a “Moving Average” block onto your workspace twice—set one to period 50 (fast MA), the other to period 200 (slow MA).
- Connect both to a “Condition” block and choose “fast MA crosses above slow MA.”
- From that condition, drag out an “Order” block and set it to “Buy at market.”

- Repeat steps 2–4 for the opposite crossover—fast MA crosses below slow MA—and attach a “Sell” block.
- Name and save your strategy.

Once it’s saved, hit “Test” to run a quick backtest on your chosen instrument and timeframe.
You’ll see your buy/sell arrows overlaid on the chart and an equity curve in the results panel.
From here you can tweak your MA periods, add stops or profit targets, and re-run tests. All this is done visually, without diving into code. Before you know it, you’ll have a solid, rule‐based system you can trust to execute itself.
Backtesting: Stress-Test Before You Deploy
Why Backtesting Matters
Running your strategy against historical data shines a light on hidden blind spots.
Those edge cases where your rules might flip-flop or miss opportunities and lets you fine‑tune your logic before you risk real cash through algo trading. By simulating years of market moves in minutes, you can spot quirks, adjust your entries or exits, and boost your confidence.
For the full deep dive, complete with step-by-step testing, risk‑metric breakdowns, and tips to sidestep traps like overfitting and look‑ahead bias, head over to our full backtesting tutorial.
Metrics to Monitor
When you’re reviewing results, focus on a handful of key stats:
- Win rate: how many trades end in profit
- Risk‑reward ratio: average gain versus average loss
- Drawdown and Maximum Drawdown: how far your equity dips
- Total Number of Trades
- Exposure rate: Percentage of time you’re in the market
- Expectancy: Average return per trade
Keeping an eye on these will give you a quick snapshot of how robust your strategy really is.
What Backtesting Can and Can’t Tell You
Backtests are great for vetting your strategy’s basic viability and weeding out obvious flaws, but they can’t predict black‑swan events or guarantee future performance.
They won’t alert you to server hiccups, slippage under live conditions, or sudden regime shifts in the market. Thus, always layer in real‑time monitoring, sensible risk limits, and the humility to tweak or pause your bot if things diverge from historical norms.

Optimizing Without Breaking Your System
What Optimization Means (And Why Most Get It Wrong)
Optimization is just a fancy word for tweaking your strategy’s knobs, like indicator periods or stop levels.
This is done to squeeze out better performance, but most traders fall into the overfitting trap. Instead of finding robust settings, they fine-tune to past quirks in the data, creating a system that only worked in hindsight and falls apart in live markets.
How to Spot an Overfit System
Indeed, an overfit strategy will show telltale signs, like tiny changes in a parameter causing wild swings in results, or absurdly high win rates paired with tiny losses, too good to be true, right?
If your equity curve hugs a straight line back in time but live performance stinks, you’ve probably tuned to noise instead of signal.
A Minimalist Approach to Optimization
Rather than chasing that mythical “best” setting, test parameters across sensible ranges and look for broad zones of stability where your strategy performs well. If your system shows similar results with a 9 to 11 period MA instead of just 10, you’ve found a more durable edge, no perfectionism required.
Paper Trading: Catch Mistakes Before They Cost You
Why Simulated Trading Still Matters
Even the slickest backtest can hide logic gaps, order-routing quirks, or faulty assumptions. You won’t see them until your strategy interacts with real-time market data. Paper trading gives you a safe sandbox to check how your bot handles live quotes, fills, and latency without risking a cent. It’s your final dress rehearsal before the real show — and the real advantage is you test in the same environment you’ll trade live.
When you paper trade, backtest, and run live trades all on the same platform, you remove 90% of the usual headaches: no need to rewrite your code, deploy a VPS, or hand off your strategy to a risky third-party bridge. Everything stays exactly as you designed it — same logic, same data, same broker connection.
It’s like taking the same car from the test track straight onto the highway.
Setting Up Paper Trading
Most platforms offer a demo account. You simply switch from live to demo and launch your automated strategy exactly as you would live.
Treat it like the real deal: monitor open orders, check error logs, and compare actual fills with your backtest assumptions. The goal is to spot execution delays and edge cases so you’re not surprised when you go live.
How to Log and Learn From Results
Finally, you should keep a simple journal or spreadsheet logging each paper trade: setup details, runtime errors, slippage, and any market oddities you notice.
Review it weekly to spot recurring hiccups or edge cases, then tweak your rules or add safeguards. Over time, your paper-trading notes become a treasure trove of lessons for your live bot.
Going Live: Deploying With Eyes Open
Final Checklist Before You Go Live
Here are a few things you should consider before going live:
- Execution Logic: Double-check that your buy/sell conditions match exactly what you tested.
- Max Position Size: Set absolute caps (in contracts/shares or $) so a bug can’t blow your account.
- Alerts: Configure notifications (email/SMS/popup) for executions, errors, or margin breaches.
- Risk Controls: Ensure stops, profit targets, and circuit breakers are in place and active.
- Fallbacks: Plan for tech failures. You should have manual order templates ready and know how to disable the bot instantly.
Activating Your Strategy
- In ProRealTime, go to Indicators → Backtesting & Autotrading and select your saved system.
- From there you select your Strategy and can either Backtest it or prep it for automated trading.

Monitoring and Adjusting in Real Time
Automation isn’t a “set-and-forget” magic wand.
Markets shift, data feeds hiccup, and parameter edges can dull over time. Spend a few minutes each session reviewing open orders, error logs, and your strategy’s recent fills. If you notice slippage creeping up or your criteria triggering far more or fewer times than expected, it’s time to tweak or pause.
Knowing When to Pause or Kill a Strategy
Trust both your numbers and your gut.
If you hit a drawdown greater than you planned like a 5–10%, or your expectancy trips below break-even, treat it as a red flag. Likewise, if the market regime has shifted (e.g., volatility spikes or correlations flip) and your bot’s signals go haywire, don’t hesitate to pull the plug. A strategy that won’t quit losing is far costlier than taking a quick timeout to recalibrate.
Managing Risk With Automated Systems
Position Sizing: Avoiding One Bad Day
Trade sizing is all about figuring out how big each position should be so that no single loss can wipe you out. A simple rule is to risk just a small percentage of your account, about 1 to 2%, on any one trade.
You can get fancy and use the Kelly Criterion to calculate theoretically optimal bet sizes, but at the end of the day, consistency and capital preservation beat hero bets every time.
Embedded Stop-Losses and Exit Logic
Never leave your exits to chance: your automated system should include hard stop-loss orders and clear exit rules tied to your strategy.
Embedding stops means your bot automatically cuts losses at your predefined level, protects profits with trailing stops, and keeps you from staring at charts hoping you picked the bottom or top.
Why Every System Needs a Manual Kill Switch
Even the best-laid automated plan needs a big red button.
Keeping manual override control gives you psychological peace of mind and a structural safety net. If markets erupt or your bot starts misbehaving, you can hit pause instantly and take back the wheel.
Final Thoughts
And there you have it!
A complete roadmap from defining a simple rule to going live with confidence. Remember, automated trading is a tool, not a magic bullet: keep your rules clear, test thoroughly, manage risk with discipline, and stay ready to pause or tweak when markets surprise you.
Start small, learn as you go, and soon you’ll feel the thrill of seeing your ideas execute themselves while you focus on refining your next big strategy.
FAQ
Do I Need to Know How to Code?
No, many platforms offer no-code visual builders. But coding can offer more flexibility over time.
Can I Make Money With Algorithmic Trading?
Possibly—but only with solid strategy design, testing, and risk control. Automation alone is not an edge.
What Programming Languages Are Used?
Python for flexibility and accessibility. C++ for speed. MQL and Pine Script for specific platforms.

Cedric is a seasoned investment management strategist with over a decade of experience, currently working at TTUTC. He holds dual prestigious designations as a Chartered Market Technician (CMT) and Chartered Financial Analyst (CFA).
Start Trading on a Demo Account
with ProRealTime Paper Trading Simulator.
