CAC 40: Companies Rankings, Weights and Performance


Often seen as a benchmark for the French economy, the CAC 40 index tracks the 40 largest companies listed on the Paris Stock Exchange. Since its inception, it has mirrored the ups and downs of France’s industrial giants, financial institutions, and luxury leaders.
Curious about its composition, performance, and trends? This guide offers key insights and visual breakdowns to help you better understand how the CAC 40 works.
CAC 40 Constituents and rankings
Launched in 1987, the CAC 40 is the flagship index of the Paris Stock Exchange. It includes 40 of the most influential French companies, many of which are global leaders in their industries.
Today, LVMH (the world’s largest luxury goods group), Total Energies (a major player in the global energy sector), and Schneider Electric (a leader in energy management and automation) rank among the index’s top market capitalizations.
CAC 40 rankings
The CAC 40 composition is reviewed quarterly, with a full reassessment every September.
Changes reflect shifting market dynamics, mergers, spinoffs, and evolving business landscapes.
| Rank | Company | Weight (%) | Button Code |
|---|---|---|---|
| 1 | LVMH | 9.52 | Open chart |
| 2 | Schneider Electric | 8.31 | Open chart |
| 3 | TotalEnergies | 7.28 | Open chart |
| 4 | Sanofi | 6.41 | Open chart |
| 5 | Airbus | 5.51 | Open chart |
| 6 | Air Liquide | 5.44 | Open chart |
| 7 | L’Oréal | 4.93 | Open chart |
| 8 | Safran | 4.61 | Open chart |
| 9 | EssilorLuxottica | 4.52 | Open chart |
| 10 | Hermès Intl | 4.41 | Open chart |
| 11 | AXA | 3.85 | Open chart |
| 12 | BNP Paribas | 3.81 | Open chart |
| 13 | Vinci | 3.17 | Open chart |
| 14 | Danone | 2.52 | Open chart |
| 15 | Saint-Gobain | 2.33 | Open chart |
| 16 | Engie | 1.68 | Open chart |
| 17 | Stellantis NV | 1.6 | Open chart |
| 18 | Legrand | 1.48 | Open chart |
| 19 | Capgemini | 1.47 | Open chart |
| 20 | Publicis Groupe | 1.41 | Open chart |
| 21 | Michelin | 1.36 | Open chart |
| 22 | Dassault Systèmes | 1.34 | Open chart |
| 23 | Pernod Ricard | 1.32 | Open chart |
| 24 | Société Générale | 1.19 | Open chart |
| 25 | Veolia | 1.12 | Open chart |
| 26 | Orange | 1.07 | Open chart |
| 27 | Kering | 1.06 | Open chart |
| 28 | STMicroelectronics | 0.93 | Open chart |
| 29 | Thales | 0.87 | Open chart |
| 30 | Crédit Agricole | 0.72 | Open chart |
| 31 | Bureau Veritas | 0.6 | Open chart |
| 32 | Renault | 0.58 | Open chart |
| 33 | Accor | 0.58 | Open chart |
| 34 | ArcelorMittal SA | 0.57 | Open chart |
| 35 | Unibail-Rodamco-Westfield | 0.52 | Open chart |
| 36 | Edenred | 0.47 | Open chart |
| 37 | Carrefour | 0.45 | Open chart |
| 38 | Eurofins Scientific | 0.37 | Open chart |
| 39 | Bouygues | 0.32 | Open chart |
| 40 | Teleperformance | 0.29 | Open chart |
Some companies—like construction and telecom giant Bouygues, banking heavyweight Société Générale, and pharmaceutical leader Sanofi—have been in the index since day one. Others joined later through high-profile mergers (BNP’s merger with Paribas), corporate restructurings (like Veolia and Vivendi), or government-led privatizations (such as Renault).
The most recent update came on December 20, 2024, when Vivendi SE exited the index following the spin-off of Havas, Louis Hachette Group, and Canal+. Bureau Veritas, a global leader in testing, inspection, and certification services, took its place.
CAC 40 sectors
The CAC 40 brings together companies from a variety of industries, but one sector stands out: consumer discretionary. It includes 10 companies offering products and services that tend to follow economic cycles. This covers a broad range, from Renault in the automotive industry, to Hermès in luxury fashion, and L’Oréal in beauty and cosmetics.
The industrial sector is just as present, with 10 companies as well. It includes businesses involved in construction, manufacturing, and logistics — key pillars of the French economy.
In contrast, the energy sector has just one representative: TotalEnergies. Despite being alone in its category, it’s one of the largest and most influential companies in the index.

How CAC 40 stocks are selected
The CAC 40 includes the largest companies listed on Euronext Paris, based on their market value and trading activity.
Although Euronext operates the index, its composition is reviewed every three months by an independent committee. This group decides which companies stay in the index — and how much weight each one has — based on two key factors:
- trading volume over the past 12 months
- market capitalization
A company’s weight in the index is capped at 15%.
CAC 40 performance
Should you invest in CAC 40 companies directly — or go with an ETF that tracks the index? To help answer that, let’s take a closer look at its historical performance.
CAC 40 from 1987 to today
The CAC 40 was set at a base value of 1,000 points in December 1987. Since then, it has seen both highs and lows, reaching its all-time record on May 10, 2024, at 8,259 points.

While the index has grown from 1,000 to over 8,200 points since its creation, the climb hasn’t been without some steep and painful drops.
In 2000, the CAC 40 reached a record high in September — only to crash nearly 63% after the dot-com bubble burst. It would take 21 years, until 2021, for the index to return to that level.
The recovery began in 2003, but momentum was cut short in 2007 by the subprime crisis, which triggered another drop of more than 60%.
Just because the market did well in the past doesn’t mean it will in the future. Investing in stocks involves risk, including the chance of losing more than what you originally invested.
CAC 40 performance over the past 10 years
Over the past 10 years, the CAC 40 has gained more than 110%. Along the way, it faced several major setbacks — a sharp drop during the Covid-19 pandemic in 2020, another during the Ukraine war in 2022, and a fresh downturn following the start of the U.S. trade war, just months after Donald Trump’s election. Still, the index climbed to a new all-time high in 2025 before its latest slide.

These setbacks pale in comparison to the crashes of 2000 and 2007. But this time, the CAC 40’s gains have been more gradual, unfolding over a longer period.

CAC 40 performance in 2024
2024 has been a major year for the CAC 40, with the index hitting a new all-time high around 8,250 points in May.
But despite that peak, the index is down 2% for the year. The chart below shows how quickly the market can shift. Two clear trends stand out:

- a steady rise through April and May
- followed by a noticeable drop starting in June, after the French president called for new parliamentary elections
Political uncertainty and the country’s budget deficit aren’t the only reasons behind the decline. The luxury sector is also slowing down, mostly due to economic challenges in China. That’s directly affecting the CAC 40’s biggest stocks, including LVMH and Hermès.
CAC 40 Performance in 2025
2025 got off to a strong start for the French index, with the CAC 40 rising 8% in the first quarter. It even came close to its all-time high from last May, boosted by strong earnings from companies like Airbus and solid momentum in the defense sector.
However, the second half of the year looks more uncertain. The rollout of new U.S. tariffs could weigh on key French industries — especially automotive and wines and spirits.

How the CAC 40 stacks up against other major indexes
CAC 40 vs. S&P 500: A different pace
If the S&P 500 is the go-to benchmark for U.S. markets, the CAC 40 plays a similar role in France — tracking 40 of the country’s largest publicly traded companies.
For much of their early history, the two indexes moved in step. But since 2009, they’ve taken very different paths. While the CAC 40 has recovered and grown, the S&P 500 has surged ahead, driven by U.S. tech giants and a longer bull run.
The gap between the two has widened sharply — a reminder that not all developed markets move at the same speed.

The trend holds true in the table below: the S&P 500 has outperformed the CAC 40 by a wide margin. The gap is narrower over the past three years, though — while 2022 was a rough year for the CAC 40 (–9.5%), it was even worse for the S&P 500 (–19.44%).
Much of the S&P’s long-term strength comes from standout performances by U.S. tech giants like Apple, NVIDIA, and Microsoft.
CAC 40 vs. S&P 500 – Performance comparison
| Timeframe | CAC 40 | S&P 500 |
|---|---|---|
| 1 year | –3.66% | +8.21% |
| 3 years | +16.35% | +22.92% |
| 5 years | +85.55% | +122.92% |
| 10 years | +54.35% | +170.74% |
CAC 40 vs. DAX 40
Some might argue that comparing the CAC 40 to the S&P 500 isn’t that meaningful — the U.S. and French markets operate on very different scales. A more relevant comparison might be with Germany’s DAX 40.
The DAX 40, launched in 1987, tracks the 40 largest companies listed on the Frankfurt Stock Exchange, including Siemens, Allianz, and Mercedes-Benz. Until 2021, it included only 30 companies, but 10 more were added to give a broader view of the German market.
One key difference: the DAX 40 includes reinvested dividends, while the standard CAC 40 does not. For a fair comparison, it’s better to use the CAC 40 GR, which includes total return.

Over the past 10 years, the DAX 40 has clearly underperformed the CAC 40 GR. That said, it’s delivered solid results over the past year. Lately, German companies appear to be holding up better under market pressure than their French counterparts.
| Timeframe | CAC 40 GR | DAX 40 |
|---|---|---|
| 1 year | –0.63% | +23.20% |
| 3 years | +27.61% | +55.21% |
| 5 years | +112.76% | +135.99% |
| 10 years | +109.08% | +88.30% |
CAC 40 dividends
CAC 40 companies have been paying out record-high dividends in recent years. For 2024, total dividends paid for the 2023 financial year exceeded €72 billion.¹
LVMH, Hermès, and Kering are among the top dividend-paying stocks in the index.
The chart below shows the dividend history of CAC 40 companies since 2018.

Final thoughts
You’ve now seen how the CAC 40 is structured, who its biggest players are, and how it has reacted to major events over time.
Whether you’re trading index futures, comparing performance across markets, or researching individual companies, understanding the index’s composition and behavior can help put market moves in context.
What matters most tends to sit at the top of the index. Watching those companies — and how sectors respond to global events — gives you a clearer view of where pressure or momentum might be coming from.
That context won’t give you the answers. But it can help you ask better questions.

Othmane has been swing trading for years and builds on experience in investment banking. He writes regularly about trading and market analysis, and has passed Level I of the CFA Program along with earning a double Master’s degree in Financial Analysis.
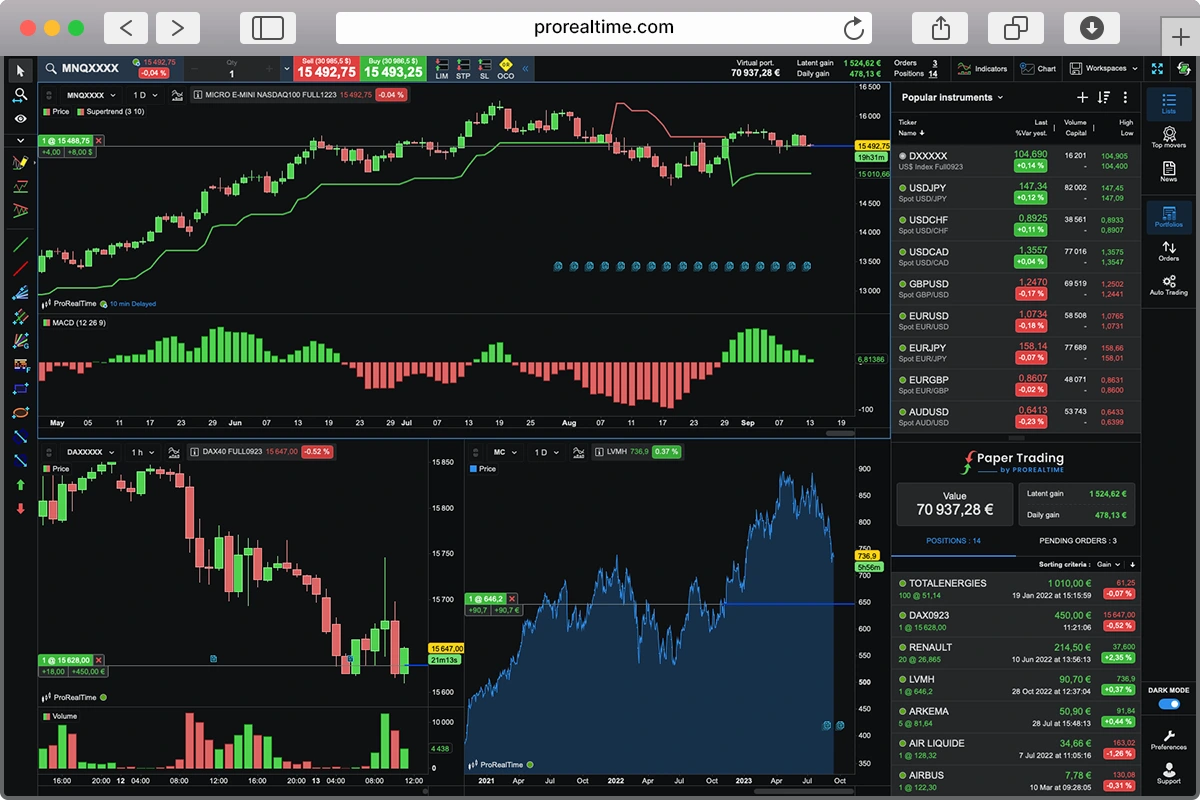
Enjoy free trading practice on
ProRealTime Paper Trading Simulator.